Question: Exhibit 6.6 shows 10 weeks including weeks 30-34 (the typical 5-week back-to-school time frame of August to the first week in September). As indicated, there

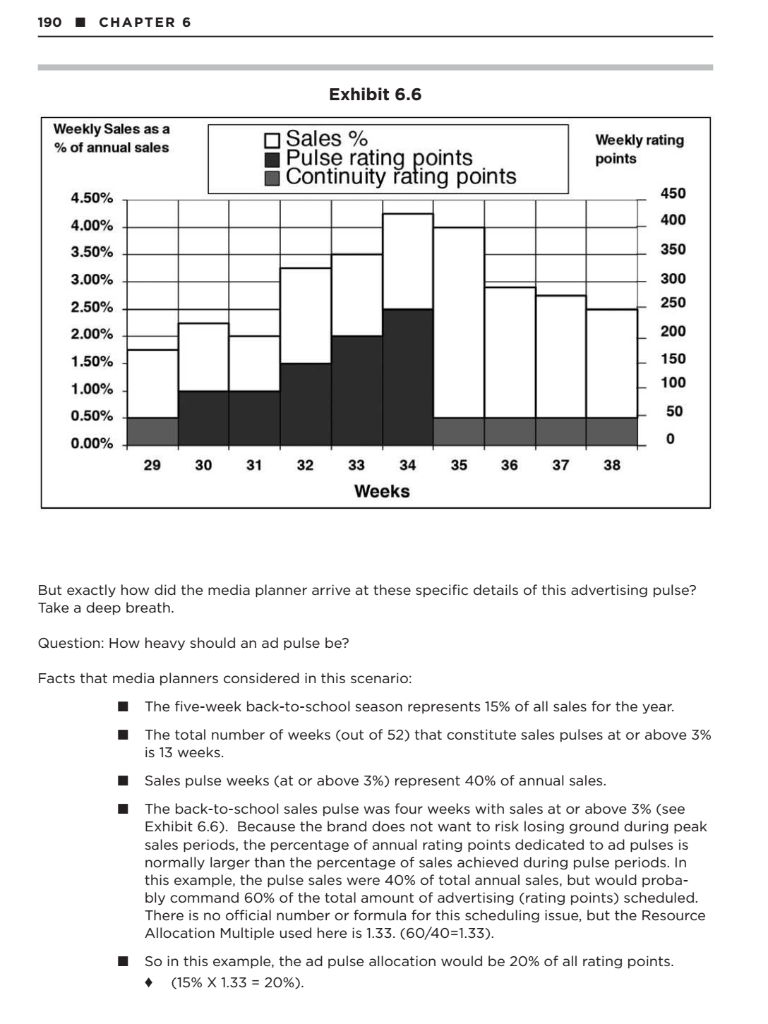
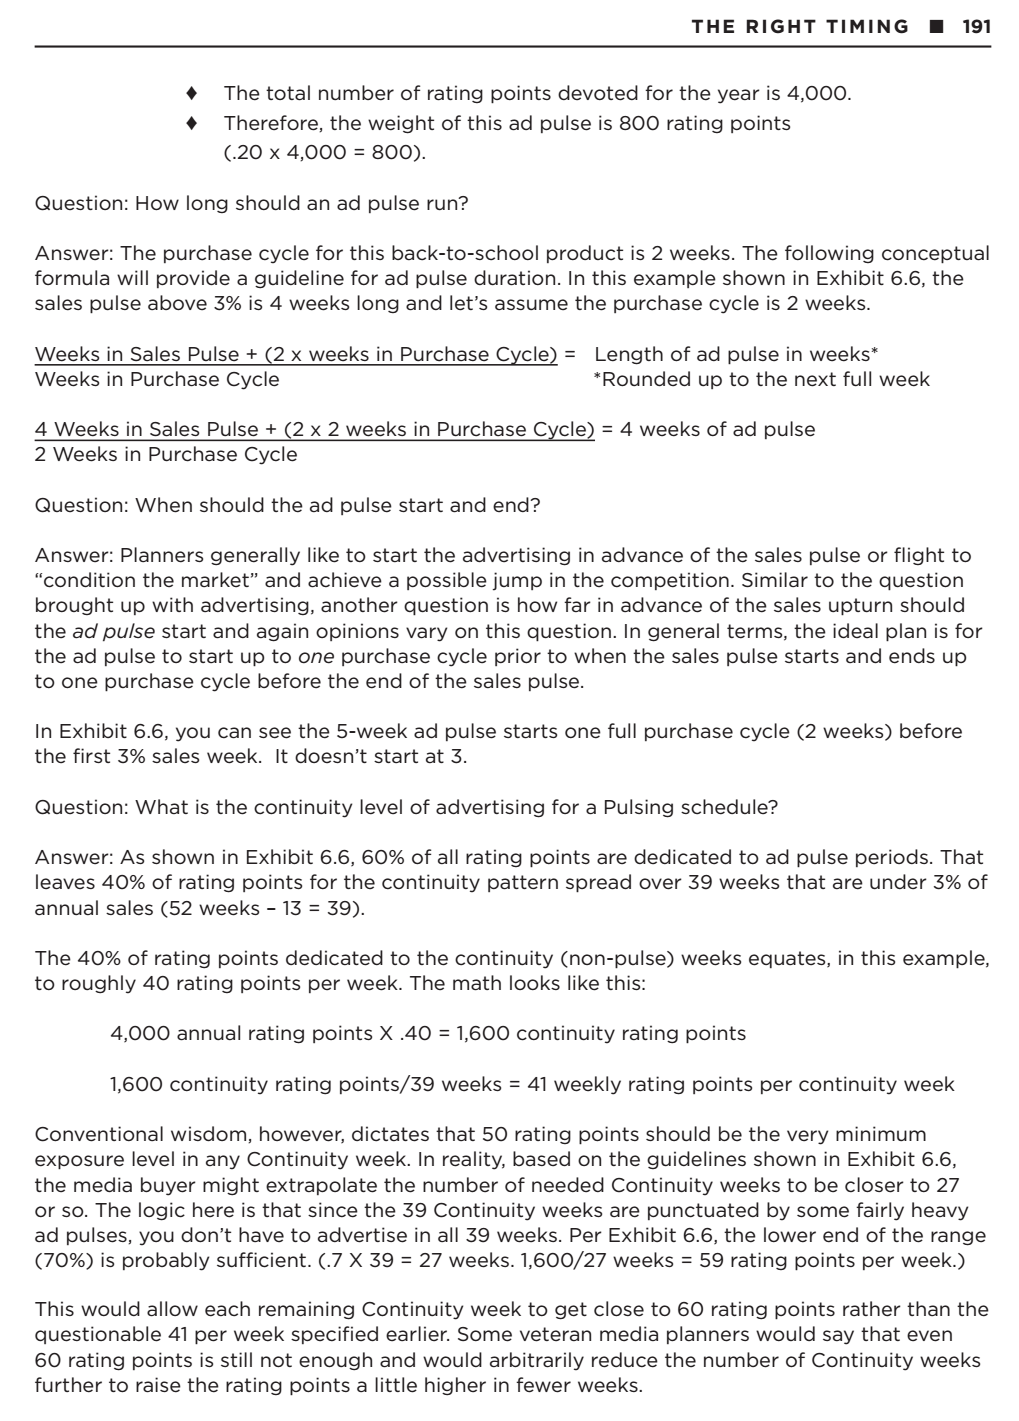
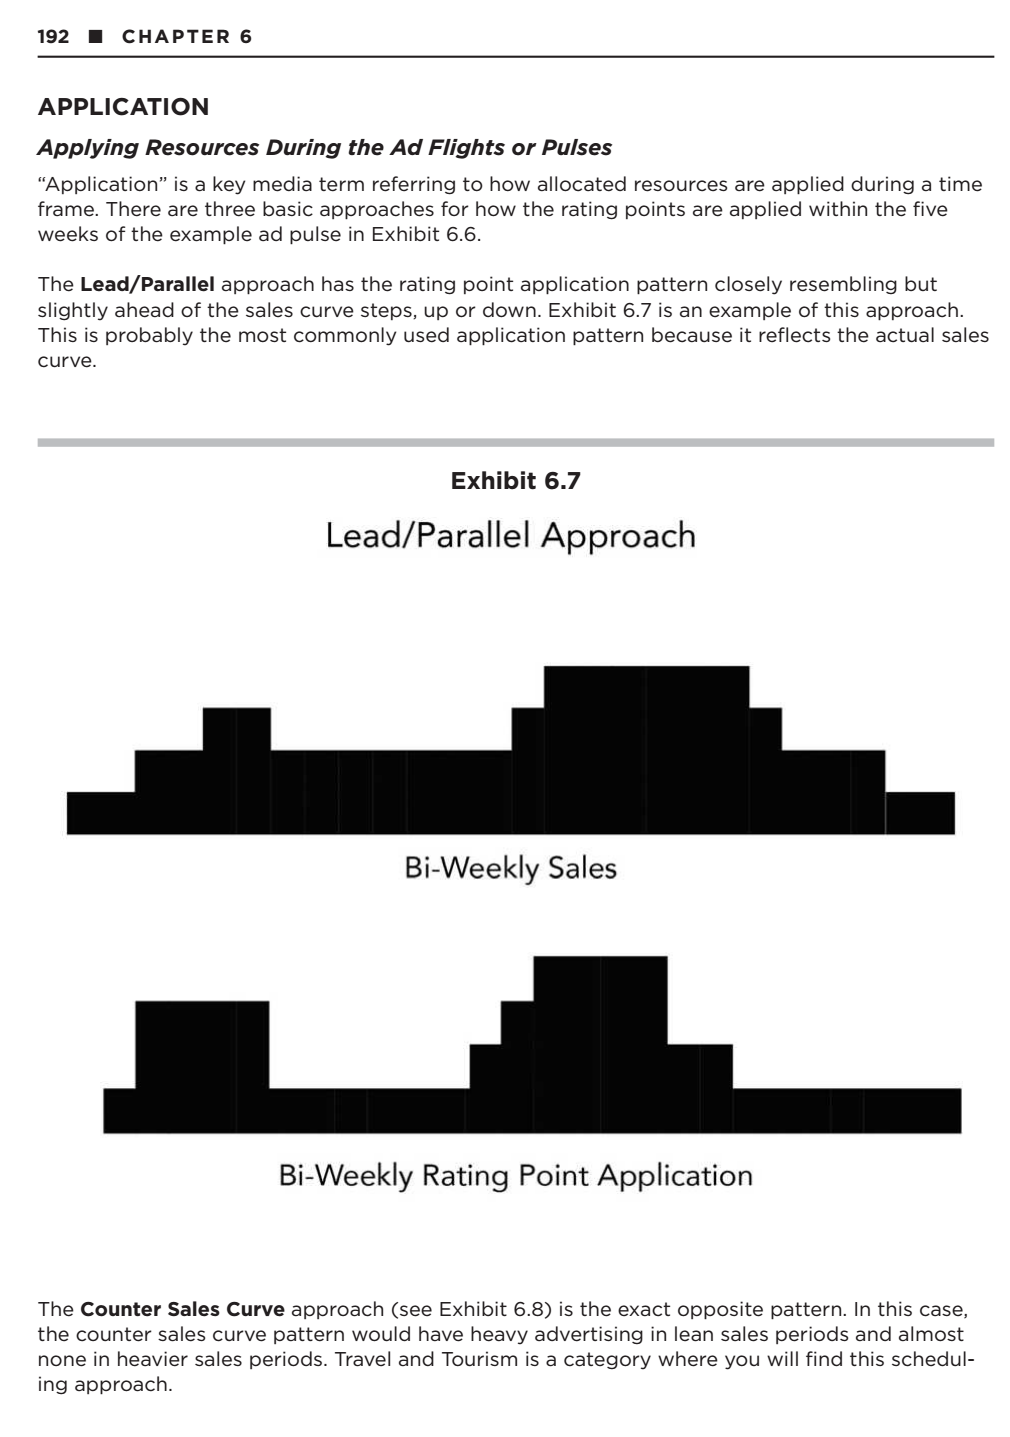
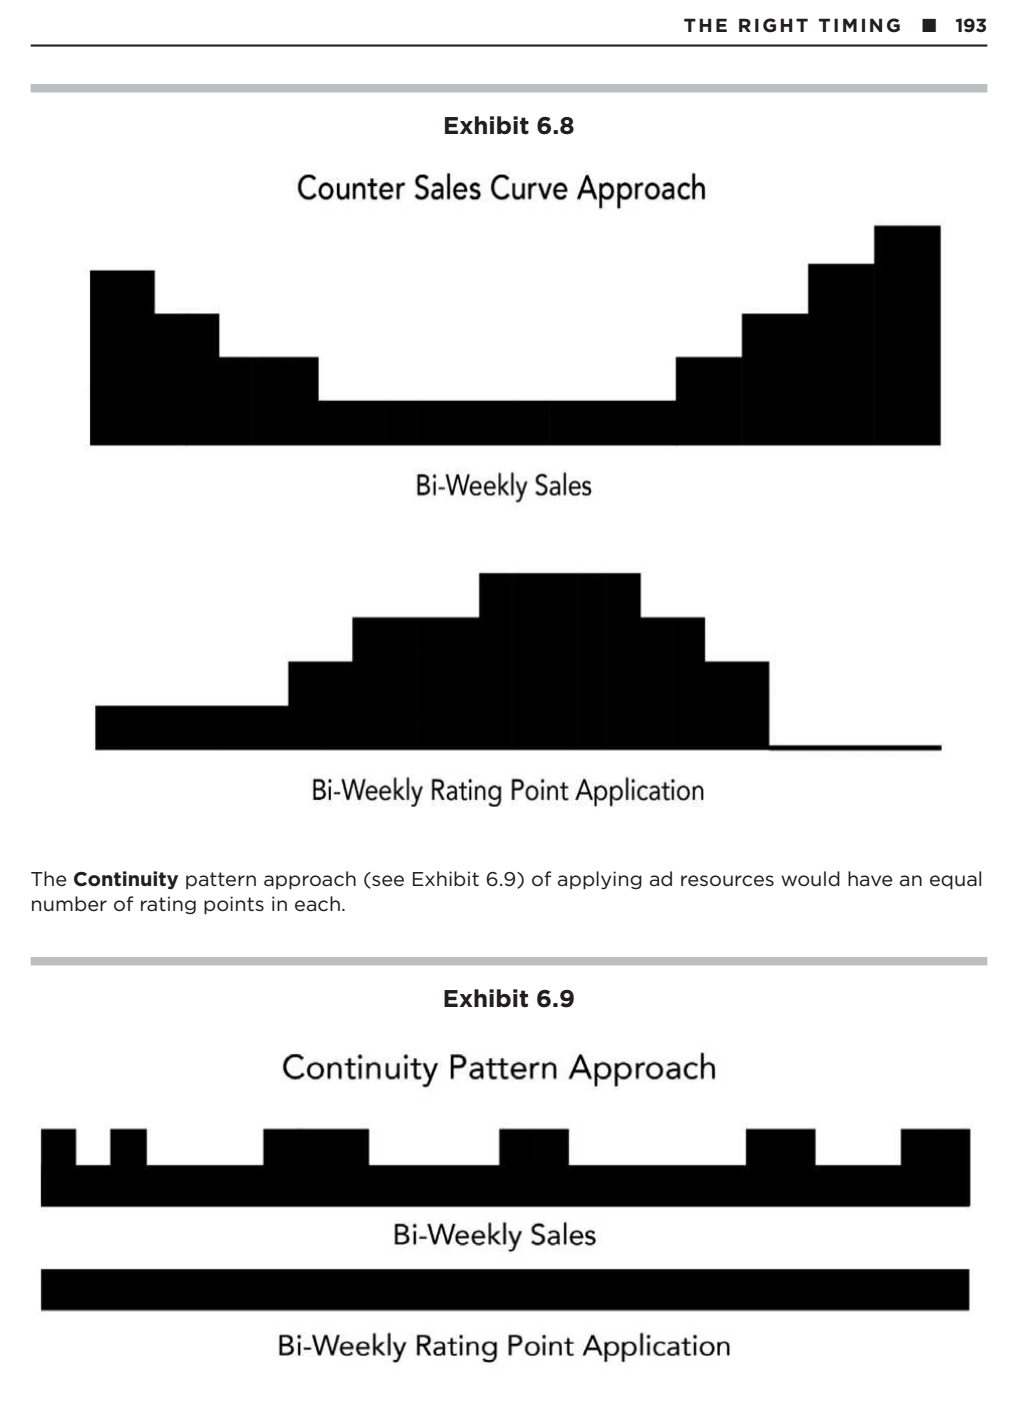
Exhibit 6.6 shows 10 weeks including weeks 30-34 (the typical 5-week back-to-school time frame of August to the first week in September). As indicated, there is paid advertising support in weeks 29 to 38, but weeks 30-34 represent a higher percentage of weekly sales and thus receive a higher number of weekly rating points. 190 CHAPTER 6 Exhibit 6.6 Weekly Sales as a % of annual sales Sales % Pulse rating points Continuity rating points Weekly rating points 4.50% 450 4.00% 400 3.50% 350 3.00% 300 250 2.50% 2.00% 200 150 1.50% 1.00% 100 0.50% 50 0.00% 0 29 30 31 32 33 34 35 36 37 38 Weeks But exactly how did the media planner arrive at these specific details of this advertising pulse? Take a deep breath. Question: How heavy should an ad pulse be? Facts that media planners considered in this scenario: The five-week back-to-school season represents 15% of all sales for the year. I The total number of weeks (out of 52) that constitute sales pulses at or above 3% is 13 weeks. Sales pulse weeks (at or above 3%) represent 40% of annual sales. The back-to-school sales pulse was four weeks with sales at or above 3% (see Exhibit 6.6). Because the brand does not want to risk losing ground during peak sales periods, the percentage of annual rating points dedicated to ad pulses is normally larger than the percentage of sales achieved during pulse periods. In this example, the pulse sales were 40% of total annual sales, but would proba- bly command 60% of the total amount of advertising (rating points) scheduled. There is no official number or formula for this scheduling issue, but the Resource Allocation Multiple used here is 1.33. (60/40=1.33). 1 So in this example, the ad pulse allocation would be 20% of all rating points. (15% X 1.33 = 20%). THE RIGHT TIMING I 191 The total number of rating points devoted for the year is 4,000. Therefore, the weight of this ad pulse is 800 rating points (.20 x 4,000 = 800). Question: How long should an ad pulse run? Answer: The purchase cycle for this back-to-school product is 2 weeks. The following conceptual formula will provide a guideline for ad pulse duration. In this example shown in Exhibit 6.6, the sales pulse above 3% is 4 weeks long and let's assume the purchase cycle is 2 weeks. Weeks in Sales Pulse + (2 x weeks in Purchase Cycle) = Length of ad pulse in weeks* Weeks in Purchase Cycle *Rounded up to the next full week 4 Weeks in Sales Pulse + (2 x 2 weeks in Purchase Cycle) = 4 weeks of ad pulse 2 Weeks in Purchase Cycle Question: When should the ad pulse start and end? Answer: Planners generally like to start the advertising in advance of the sales pulse or flight to "condition the market and achieve a possible jump in the competition. Similar to the question brought up with advertising, another question is how far in advance of the sales upturn should the ad pulse start and again opinions vary on this question. In general terms, the ideal plan is for the ad pulse to start up to one purchase cycle prior to when the sales pulse starts and ends up to one purchase cycle before the end of the sales pulse. In Exhibit 6.6, you can see the 5-week ad pulse starts one full purchase cycle (2 weeks) before the first 3% sales week. It doesn't start at 3. Question: What is the continuity level of advertising for a Pulsing schedule? Answer: As shown in Exhibit 6.6, 60% of all rating points are dedicated to ad pulse periods. That leaves 40% of rating points for the continuity pattern spread over 39 weeks that are under 3% of annual sales (52 weeks - 13 = 39). The 40% of rating points dedicated to the continuity (non-pulse) weeks equates, in this example, to roughly 40 rating points per week. The math looks like this: 4,000 annual rating points X.40 = 1,600 continuity rating points 1,600 continuity rating points/39 weeks = 41 weekly rating points per continuity week Conventional wisdom, however, dictates that 50 rating points should be the very minimum exposure level in any Continuity week. In reality, based on the guidelines shown in Exhibit 6.6, the media buyer might extrapolate the number of needed Continuity weeks to be closer to 27 or so. The logic here is that since the 39 Continuity weeks are punctuated by some fairly heavy ad pulses, you don't have to advertise in all 39 weeks. Per Exhibit 6.6, the lower end of the range (70%) is probably sufficient. (.7 X 39 = 27 weeks. 1,600/27 weeks = 59 rating points per week.) This would allow each remaining Continuity week to get close to 60 rating points rather than the questionable 41 per week specified earlier. Some veteran media planners would say that even 60 rating points is still not enough and would arbitrarily reduce the number of Continuity weeks further to raise the rating points a little higher in fewer weeks. 192 CHAPTER 6 APPLICATION Applying Resources During the Ad Flights or Pulses Application is a key media term referring to how allocated resources are applied during a time frame. There are three basic approaches for how the rating points are applied within the five weeks of the example ad pulse in Exhibit 6.6. The Lead/Parallel approach has the rating point application pattern closely resembling but slightly ahead of the sales curve steps, up or down. Exhibit 6.7 is an example of this approach. This is probably the most commonly used application pattern because it reflects the actual sales curve. Exhibit 6.7 Lead/Parallel Approach Bi-Weekly Sales Bi-Weekly Rating Point Application The Counter Sales Curve approach (see Exhibit 6.8) is the exact opposite pattern. In this case, the counter sales curve pattern would have heavy advertising in lean sales periods and almost none in heavier sales periods. Travel and Tourism is a category where you will find this schedul- ing approach. THE RIGHT TIMING I 193 Exhibit 6.8 Counter Sales Curve Approach Bi-Weekly Sales Bi-Weekly Rating Point Application The Continuity pattern approach (see Exhibit 6.9) of applying ad resources would have an equal number of rating points in each. Exhibit 6.9 Continuity Pattern Approach Bi-Weekly Sales Bi-Weekly Rating Point Application 194 CHAPTER 6 Additional Application Techniques within Ad Flights And Pulses Front-End Loading (Macro) Front-end loading is a classic scheduling pattern specifically associated with new product introductions and Flighting ad campaigns occurring after a long period of no advertising. The concept behind front-end loading is this: To keep people's attention in the taper phase of a campaign, you have to first gain attention. Therefore, make sure early-on that your campaign is heavy enough to be noticed. Exhibit 6.10 Front-end Loading RATING POINTS Week 5 K>>>>>l>>>>> Exhibit 6.10 is a magnified five-week view of one of the three ad pulses shown in Exhibit 6.11. This exploded view shows how a front-end loaded schedule can also fit nicely in a five-week Pulsing pattern with continuity scheduling before and after. Exhibit 6.11 Pulsing Pattern Over One Year Micro front end loading focuses on what happens inside these weeks, days and dayparts. See exhibit 6.12 Week 4 5 6 7 8 9 10 11 12 13 14 15 16 17 18 | THE RIGHT TIMING 1 195 Micro Front-end Loading Micro front-end loading deals with what happens inside the weeks of a Flight or Pulse during specific days and dayparts. Micro front-end loading is practiced most often in radio, television, daily newspapers, and digital display where each week can be front-end loaded with more ads running on Monday through Wednesday or Thursday. In these media (except for newspapers), each day can be front-end loaded with more ads running in early dayparts. Exhibit 6.12 illustrates micro front-end loading for a two-week radio schedule. Exhibit 6.12 Micro Front-end Loading 8 PM 7 PM 6 PM 5 PM 4 PM 3 PM 2 PM 1 PM 12 PM 11 AM 10 AM 9 AM 8 AM 7 AM 6 AM M T W TH F S S M T w TH F S S Week 1 Week 2 Back-end Loading Some products use more of a back-end loading pattern. Movies are the classic product category in which the product is advertised a little bit before it is even available. These "teaser" ads start sometimes weeks ahead of the opening or product launch. Then, heavy advertising increases as the opening or product debut takes place, thus back-end loading. Simultaneous versus Sequential Scheduling Another important media consideration is whether different media will be scheduled in a simul- taneous pattern or a sequential pattern. At its purest, simultaneous means media will be used at the same time in roughly the same weights. At its purest, sequential means that media will be used one following another with very little, if any, overlap. 196 1 CHAPTER 6 In the illustrations shown here, you can see two approaches to the same process of scheduling two different media. The simultaneous approaches shown in Exhibit 6.14 front-end loads both media. The chart shows that in the beginning of the campaign, for the first three weeks, TV and Digital GRPs (or budget allocations) are higher. From week 4 to week 13, the GRP or budget al- locations are not as high. The scheduling is simultaneous in that they are the same time and the same weights. Exhibit 6.13 Simultaneous Scheduling #1 Front-End Loading TV Week 1 2 4 6 7 8 9 10 11 12 13 DIGITAL DIGITAL Exhibit 6.14 shows another example of simultaneous scheduling that is not front-end loaded. The scheduling is simultaneous in they are the same time and the same weights. Exhibit 6.14 Simultaneous Scheduling #2 Week 2 3 5 6 7 8 9 10 11 12 13 TV DIGITAL Exhibit 6.15 Sequential Scheduling TV Week 1 2 3 4 5 6 7 8 9 10 11 12 13 DIGITAL THE RIGHT TIMING I 197 The sequential scheduling approach (Exhibit 6.15) would lead with TV because it is a more pow- erful medium and finish with digital because it is less expensive. Leading with TV and following with digital can also benefit from image transfer if the TV message was memorable and the dig- ital message in display and video takes advantage of the reach of the TV campaign. Notice that with sequential media one medium follows another (TV followed by digital) and there is very little, if any, overlap. Another scheduling pattern is called "leap frogging" where media jumps back and forth as shown in Exhibit 6.16. Exhibit 6.17 shows checkerboarding," a type of media scheduling pattern with three media that resembles a checkerboard. Exhibit 6.16 Leap Frog Scheduling (Over 13 Weeks) TV TV DIGITAL TV DIGITAL TV DIGITAL TV DIGITAL TV DIGITAL TV DIGITAL Exhibit 6.17 Cherkerboard Scheduling For Three or More Media (Over 13 Weeks) TV DIGITAL NAT'L NWP In reality, most multimedia plans are a combination of simultaneous and sequential but still tend to favor one pattern over the other. There is no right or wrong pattern, only the need to examine the plan in view of the simultaneous versus sequential alternatives and have a solid rationale for what is being proposed. THE RIGHT TIMING I 199 There are three reasons that media planners for nonpolitical campaigns like to avoid advertising in broadcast media prior to elections. 1. During the political windows, the availability of good ad positions in broadcast media may be reduced because candidates and ballot measures have added to the competition for finite ad time. 2. There is normally a significantly higher number of ads run during an election season, so viewers and listeners simply tune out the clutter, including the nonpo- litical ads. 3. Politicians have the availability to bump nonpolitical advertisers from ad posi- tions that had been scheduled months in advance. So a nonpolitical ad campaign may end up running only intermittently. For paid digital advertising, many in business and government feel there should be standards for online political advertising similar to television radio and print. An "Honest Ads Act for online political advertising was introduced in 2017. This proposed legislation required clear and con- spicuous sponsorship disclosures on all electioneering communication. While this legislation did not progress, foreign meddling in U.S. elections make it likely that fur- ther government regulation of online political advertising will occur. MEDIA FLOWCHARTS After the media planner has addressed all the seasonality, scheduling, allocation, and application issues, the next step is to visualize the complete media plan. This is the function of the media flowchart. Flowcharts are a lot of work and are packed with detail. But when done well, flowcharts are in- valuable in helping clients (especially those with limited media expertise) understand what hap- pens when. Exhibit 6.19 is a suggested format. The time interval for media flowcharts is normally shown in weeks with monthly headings over the top. Broadcast advertising is shown during the weeks used. The number of ads in each medium is shown in the week they appear. Rating points are shown for each broadcast flight. The internet section is most often shown by week or month, the number of impressions or clicks that are planned for purchase. Print media are shown for the week or months, depending on their publishing frequency. The number of ads in each medium is shown in the week they appear. For monthly magazines, news- stand availability normally does not coincide with the beginning and end of the cover month. For purposes of flowcharting, the media planner must know when the monthly publication actually "hits the street." Impressions, rating points, and costs are ideally reported in table form under the flowchart. Rat- ing point delivery and the client's sales pattern are plotted above the flowchart. The horizontal graph at the very top of the flowchart in Exhibit 6.19 plots the target rating points by week (dashed line) compared to the sales curve. The generous use of colors and media logos throughout the flowchart make it more interesting and easy to understand. Exercise 6A: Media Scheduling Revisit the presentation of scheduling patterns in this chapter and then answer the following questions. 1. Brand A has weekly sales ranging from 1.6%-2.4% of annual sales and a purchase cycle of three weeks. Which classic scheduling pattern best suits this sales curve? 2. What is the midpoint number of weeks of advertising that is roughly optimal for Brand A? weeks 3. Brand B has a sales curve with multiple patterns like the one shown below and a purchase cycle of two weeks. Week 6....1.6% Week 7....1.8% Week 8....3.3% Week 9....3.7% Week 10....4.1% Week 11....4.4% Week 12....4.4% Week 13....3.9% Week 14....2.5% Week 15....2.1% a. What classic scheduling pattern is the most likely candidate for this product? b. What is the weekly sales threshold that triggers additional advertising activity? c. How many weeks are above the weekly sales threshold? d. What percentage of total sales do these heavy sales weeks represent? e. Using the guideline in the explanation, what percentage of annual rating points are likely to be dedicated to this specific heavy-up schedule? f. If the annual rating point target was 4,000, how many rating points would you dedicate to this flight based on your answer to the previous question? weeks. (Show your g. How long should this heavy-up advertising schedule run? formula work here.) h. When should this heavy-up advertising start? Week # 4. For the example in question 3, chart the weekly sales on the following grid and overlay the pulsing ad schedule showing how you would schedule the rating points you have allocated in question 3f. Weekly sales as a % of annual sales 5.0% Sales% Continuity rating points Pulse rating points Weekly rating points 500 4.5% 450 4.0% 400 3.5% 350 3.0% 300 2.5% 250 2.0% 200 1.5% 150 1.0% 100 0.5% 50 0.0% 0 5 6 7 8 9 10 11 12 13 14 Weeks 5a. Assume two other ad pulses during the year that are each half the length and rating points of this one in question 3. How many total weeks of ad pulses will you plan? b. Based on your answer to 5a, how many unadjusted Continuity weeks are left? c. How many total rating points will be dedicated to ad pulses? d. Based on 4,000 rating points for the whole year, how many rating points will be left for Continuity weeks? e. Based on a purchase cycle of three weeks, use the table on page 187 to determine what is the range of Continuity weeks should be before any pulse weeks are deducted. weeks f. Deduct 12 pulse weeks from both ends of the range in question 5e. g. To determine the optimum number of Continuity weeks in which to advertise, select the mid- point in the adjusted range in question 5f. h. Based on the answer to question 5g, how many rating points would be allocated for each Continuity week? Exhibit 6.6 shows 10 weeks including weeks 30-34 (the typical 5-week back-to-school time frame of August to the first week in September). As indicated, there is paid advertising support in weeks 29 to 38, but weeks 30-34 represent a higher percentage of weekly sales and thus receive a higher number of weekly rating points. 190 CHAPTER 6 Exhibit 6.6 Weekly Sales as a % of annual sales Sales % Pulse rating points Continuity rating points Weekly rating points 4.50% 450 4.00% 400 3.50% 350 3.00% 300 250 2.50% 2.00% 200 150 1.50% 1.00% 100 0.50% 50 0.00% 0 29 30 31 32 33 34 35 36 37 38 Weeks But exactly how did the media planner arrive at these specific details of this advertising pulse? Take a deep breath. Question: How heavy should an ad pulse be? Facts that media planners considered in this scenario: The five-week back-to-school season represents 15% of all sales for the year. I The total number of weeks (out of 52) that constitute sales pulses at or above 3% is 13 weeks. Sales pulse weeks (at or above 3%) represent 40% of annual sales. The back-to-school sales pulse was four weeks with sales at or above 3% (see Exhibit 6.6). Because the brand does not want to risk losing ground during peak sales periods, the percentage of annual rating points dedicated to ad pulses is normally larger than the percentage of sales achieved during pulse periods. In this example, the pulse sales were 40% of total annual sales, but would proba- bly command 60% of the total amount of advertising (rating points) scheduled. There is no official number or formula for this scheduling issue, but the Resource Allocation Multiple used here is 1.33. (60/40=1.33). 1 So in this example, the ad pulse allocation would be 20% of all rating points. (15% X 1.33 = 20%). THE RIGHT TIMING I 191 The total number of rating points devoted for the year is 4,000. Therefore, the weight of this ad pulse is 800 rating points (.20 x 4,000 = 800). Question: How long should an ad pulse run? Answer: The purchase cycle for this back-to-school product is 2 weeks. The following conceptual formula will provide a guideline for ad pulse duration. In this example shown in Exhibit 6.6, the sales pulse above 3% is 4 weeks long and let's assume the purchase cycle is 2 weeks. Weeks in Sales Pulse + (2 x weeks in Purchase Cycle) = Length of ad pulse in weeks* Weeks in Purchase Cycle *Rounded up to the next full week 4 Weeks in Sales Pulse + (2 x 2 weeks in Purchase Cycle) = 4 weeks of ad pulse 2 Weeks in Purchase Cycle Question: When should the ad pulse start and end? Answer: Planners generally like to start the advertising in advance of the sales pulse or flight to "condition the market and achieve a possible jump in the competition. Similar to the question brought up with advertising, another question is how far in advance of the sales upturn should the ad pulse start and again opinions vary on this question. In general terms, the ideal plan is for the ad pulse to start up to one purchase cycle prior to when the sales pulse starts and ends up to one purchase cycle before the end of the sales pulse. In Exhibit 6.6, you can see the 5-week ad pulse starts one full purchase cycle (2 weeks) before the first 3% sales week. It doesn't start at 3. Question: What is the continuity level of advertising for a Pulsing schedule? Answer: As shown in Exhibit 6.6, 60% of all rating points are dedicated to ad pulse periods. That leaves 40% of rating points for the continuity pattern spread over 39 weeks that are under 3% of annual sales (52 weeks - 13 = 39). The 40% of rating points dedicated to the continuity (non-pulse) weeks equates, in this example, to roughly 40 rating points per week. The math looks like this: 4,000 annual rating points X.40 = 1,600 continuity rating points 1,600 continuity rating points/39 weeks = 41 weekly rating points per continuity week Conventional wisdom, however, dictates that 50 rating points should be the very minimum exposure level in any Continuity week. In reality, based on the guidelines shown in Exhibit 6.6, the media buyer might extrapolate the number of needed Continuity weeks to be closer to 27 or so. The logic here is that since the 39 Continuity weeks are punctuated by some fairly heavy ad pulses, you don't have to advertise in all 39 weeks. Per Exhibit 6.6, the lower end of the range (70%) is probably sufficient. (.7 X 39 = 27 weeks. 1,600/27 weeks = 59 rating points per week.) This would allow each remaining Continuity week to get close to 60 rating points rather than the questionable 41 per week specified earlier. Some veteran media planners would say that even 60 rating points is still not enough and would arbitrarily reduce the number of Continuity weeks further to raise the rating points a little higher in fewer weeks. 192 CHAPTER 6 APPLICATION Applying Resources During the Ad Flights or Pulses Application is a key media term referring to how allocated resources are applied during a time frame. There are three basic approaches for how the rating points are applied within the five weeks of the example ad pulse in Exhibit 6.6. The Lead/Parallel approach has the rating point application pattern closely resembling but slightly ahead of the sales curve steps, up or down. Exhibit 6.7 is an example of this approach. This is probably the most commonly used application pattern because it reflects the actual sales curve. Exhibit 6.7 Lead/Parallel Approach Bi-Weekly Sales Bi-Weekly Rating Point Application The Counter Sales Curve approach (see Exhibit 6.8) is the exact opposite pattern. In this case, the counter sales curve pattern would have heavy advertising in lean sales periods and almost none in heavier sales periods. Travel and Tourism is a category where you will find this schedul- ing approach. THE RIGHT TIMING I 193 Exhibit 6.8 Counter Sales Curve Approach Bi-Weekly Sales Bi-Weekly Rating Point Application The Continuity pattern approach (see Exhibit 6.9) of applying ad resources would have an equal number of rating points in each. Exhibit 6.9 Continuity Pattern Approach Bi-Weekly Sales Bi-Weekly Rating Point Application 194 CHAPTER 6 Additional Application Techniques within Ad Flights And Pulses Front-End Loading (Macro) Front-end loading is a classic scheduling pattern specifically associated with new product introductions and Flighting ad campaigns occurring after a long period of no advertising. The concept behind front-end loading is this: To keep people's attention in the taper phase of a campaign, you have to first gain attention. Therefore, make sure early-on that your campaign is heavy enough to be noticed. Exhibit 6.10 Front-end Loading RATING POINTS Week 5 K>>>>>l>>>>> Exhibit 6.10 is a magnified five-week view of one of the three ad pulses shown in Exhibit 6.11. This exploded view shows how a front-end loaded schedule can also fit nicely in a five-week Pulsing pattern with continuity scheduling before and after. Exhibit 6.11 Pulsing Pattern Over One Year Micro front end loading focuses on what happens inside these weeks, days and dayparts. See exhibit 6.12 Week 4 5 6 7 8 9 10 11 12 13 14 15 16 17 18 | THE RIGHT TIMING 1 195 Micro Front-end Loading Micro front-end loading deals with what happens inside the weeks of a Flight or Pulse during specific days and dayparts. Micro front-end loading is practiced most often in radio, television, daily newspapers, and digital display where each week can be front-end loaded with more ads running on Monday through Wednesday or Thursday. In these media (except for newspapers), each day can be front-end loaded with more ads running in early dayparts. Exhibit 6.12 illustrates micro front-end loading for a two-week radio schedule. Exhibit 6.12 Micro Front-end Loading 8 PM 7 PM 6 PM 5 PM 4 PM 3 PM 2 PM 1 PM 12 PM 11 AM 10 AM 9 AM 8 AM 7 AM 6 AM M T W TH F S S M T w TH F S S Week 1 Week 2 Back-end Loading Some products use more of a back-end loading pattern. Movies are the classic product category in which the product is advertised a little bit before it is even available. These "teaser" ads start sometimes weeks ahead of the opening or product launch. Then, heavy advertising increases as the opening or product debut takes place, thus back-end loading. Simultaneous versus Sequential Scheduling Another important media consideration is whether different media will be scheduled in a simul- taneous pattern or a sequential pattern. At its purest, simultaneous means media will be used at the same time in roughly the same weights. At its purest, sequential means that media will be used one following another with very little, if any, overlap. 196 1 CHAPTER 6 In the illustrations shown here, you can see two approaches to the same process of scheduling two different media. The simultaneous approaches shown in Exhibit 6.14 front-end loads both media. The chart shows that in the beginning of the campaign, for the first three weeks, TV and Digital GRPs (or budget allocations) are higher. From week 4 to week 13, the GRP or budget al- locations are not as high. The scheduling is simultaneous in that they are the same time and the same weights. Exhibit 6.13 Simultaneous Scheduling #1 Front-End Loading TV Week 1 2 4 6 7 8 9 10 11 12 13 DIGITAL DIGITAL Exhibit 6.14 shows another example of simultaneous scheduling that is not front-end loaded. The scheduling is simultaneous in they are the same time and the same weights. Exhibit 6.14 Simultaneous Scheduling #2 Week 2 3 5 6 7 8 9 10 11 12 13 TV DIGITAL Exhibit 6.15 Sequential Scheduling TV Week 1 2 3 4 5 6 7 8 9 10 11 12 13 DIGITAL THE RIGHT TIMING I 197 The sequential scheduling approach (Exhibit 6.15) would lead with TV because it is a more pow- erful medium and finish with digital because it is less expensive. Leading with TV and following with digital can also benefit from image transfer if the TV message was memorable and the dig- ital message in display and video takes advantage of the reach of the TV campaign. Notice that with sequential media one medium follows another (TV followed by digital) and there is very little, if any, overlap. Another scheduling pattern is called "leap frogging" where media jumps back and forth as shown in Exhibit 6.16. Exhibit 6.17 shows checkerboarding," a type of media scheduling pattern with three media that resembles a checkerboard. Exhibit 6.16 Leap Frog Scheduling (Over 13 Weeks) TV TV DIGITAL TV DIGITAL TV DIGITAL TV DIGITAL TV DIGITAL TV DIGITAL Exhibit 6.17 Cherkerboard Scheduling For Three or More Media (Over 13 Weeks) TV DIGITAL NAT'L NWP In reality, most multimedia plans are a combination of simultaneous and sequential but still tend to favor one pattern over the other. There is no right or wrong pattern, only the need to examine the plan in view of the simultaneous versus sequential alternatives and have a solid rationale for what is being proposed. THE RIGHT TIMING I 199 There are three reasons that media planners for nonpolitical campaigns like to avoid advertising in broadcast media prior to elections. 1. During the political windows, the availability of good ad positions in broadcast media may be reduced because candidates and ballot measures have added to the competition for finite ad time. 2. There is normally a significantly higher number of ads run during an election season, so viewers and listeners simply tune out the clutter, including the nonpo- litical ads. 3. Politicians have the availability to bump nonpolitical advertisers from ad posi- tions that had been scheduled months in advance. So a nonpolitical ad campaign may end up running only intermittently. For paid digital advertising, many in business and government feel there should be standards for online political advertising similar to television radio and print. An "Honest Ads Act for online political advertising was introduced in 2017. This proposed legislation required clear and con- spicuous sponsorship disclosures on all electioneering communication. While this legislation did not progress, foreign meddling in U.S. elections make it likely that fur- ther government regulation of online political advertising will occur. MEDIA FLOWCHARTS After the media planner has addressed all the seasonality, scheduling, allocation, and application issues, the next step is to visualize the complete media plan. This is the function of the media flowchart. Flowcharts are a lot of work and are packed with detail. But when done well, flowcharts are in- valuable in helping clients (especially those with limited media expertise) understand what hap- pens when. Exhibit 6.19 is a suggested format. The time interval for media flowcharts is normally shown in weeks with monthly headings over the top. Broadcast advertising is shown during the weeks used. The number of ads in each medium is shown in the week they appear. Rating points are shown for each broadcast flight. The internet section is most often shown by week or month, the number of impressions or clicks that are planned for purchase. Print media are shown for the week or months, depending on their publishing frequency. The number of ads in each medium is shown in the week they appear. For monthly magazines, news- stand availability normally does not coincide with the beginning and end of the cover month. For purposes of flowcharting, the media planner must know when the monthly publication actually "hits the street." Impressions, rating points, and costs are ideally reported in table form under the flowchart. Rat- ing point delivery and the client's sales pattern are plotted above the flowchart. The horizontal graph at the very top of the flowchart in Exhibit 6.19 plots the target rating points by week (dashed line) compared to the sales curve. The generous use of colors and media logos throughout the flowchart make it more interesting and easy to understand. Exercise 6A: Media Scheduling Revisit the presentation of scheduling patterns in this chapter and then answer the following questions. 1. Brand A has weekly sales ranging from 1.6%-2.4% of annual sales and a purchase cycle of three weeks. Which classic scheduling pattern best suits this sales curve? 2. What is the midpoint number of weeks of advertising that is roughly optimal for Brand A? weeks 3. Brand B has a sales curve with multiple patterns like the one shown below and a purchase cycle of two weeks. Week 6....1.6% Week 7....1.8% Week 8....3.3% Week 9....3.7% Week 10....4.1% Week 11....4.4% Week 12....4.4% Week 13....3.9% Week 14....2.5% Week 15....2.1% a. What classic scheduling pattern is the most likely candidate for this product? b. What is the weekly sales threshold that triggers additional advertising activity? c. How many weeks are above the weekly sales threshold? d. What percentage of total sales do these heavy sales weeks represent? e. Using the guideline in the explanation, what percentage of annual rating points are likely to be dedicated to this specific heavy-up schedule? f. If the annual rating point target was 4,000, how many rating points would you dedicate to this flight based on your answer to the previous question? weeks. (Show your g. How long should this heavy-up advertising schedule run? formula work here.) h. When should this heavy-up advertising start? Week # 4. For the example in question 3, chart the weekly sales on the following grid and overlay the pulsing ad schedule showing how you would schedule the rating points you have allocated in question 3f. Weekly sales as a % of annual sales 5.0% Sales% Continuity rating points Pulse rating points Weekly rating points 500 4.5% 450 4.0% 400 3.5% 350 3.0% 300 2.5% 250 2.0% 200 1.5% 150 1.0% 100 0.5% 50 0.0% 0 5 6 7 8 9 10 11 12 13 14 Weeks 5a. Assume two other ad pulses during the year that are each half the length and rating points of this one in question 3. How many total weeks of ad pulses will you plan? b. Based on your answer to 5a, how many unadjusted Continuity weeks are left? c. How many total rating points will be dedicated to ad pulses? d. Based on 4,000 rating points for the whole year, how many rating points will be left for Continuity weeks? e. Based on a purchase cycle of three weeks, use the table on page 187 to determine what is the range of Continuity weeks should be before any pulse weeks are deducted. weeks f. Deduct 12 pulse weeks from both ends of the range in question 5e. g. To determine the optimum number of Continuity weeks in which to advertise, select the mid- point in the adjusted range in question 5f. h. Based on the answer to question 5g, how many rating points would be allocated for each Continuity week


