

Question
Exhibit contains cash-flow statements from Gamma Corporation. The CF statement has three years of data. Examine the contents of these cash-flow statements carefully. Answer the
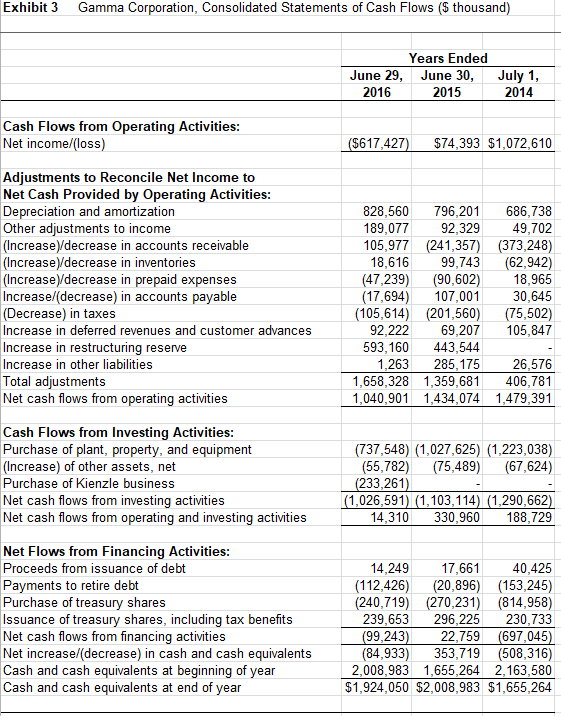
Exhibit contains cash-flow statements from Gamma Corporation. The CF statement has three years of data. Examine the contents of these cash-flow statements carefully. Answer the following questions about EACH OF THREE YEARS of CF statements.
1. For each of the years on the Statement of CFs: a. What were the firms major sources of cash? Its major uses of cash? b. Was CF from operations greater than or less than net income? Explain in detail the major reasons for the difference between these two figures? c. Was the firm able to generate enough cash from operations to pay for all its capital expenditures? d. Did the CF from operations cover both the capital expenditures and the firms dividend payments, if any? e. If it did, how did the firm invest its excess cash? f. If not, what were the sources of cash the firm used to pay for the capital expenditures and/or dividends? g. Were the working capital (current asset or current liability) accounts other than cash and cash equivalents primarily sources of cash, or uses of cash? h. What other major items affected cash flows?
2. What was the trend in: a. Net income? b. Cash flow from (continuing operations? c. Capital expenditures? d. Dividends? e. Net borrowing (proceeds less payments of short- and long-term debt)? f. Working capital accounts?
3. Based on the evidence in the Statement of CFs alone, what is your assessment of the financial strength of this business? Why?
Step by Step Solution
There are 3 Steps involved in it
Step: 1

Get Instant Access to Expert-Tailored Solutions
See step-by-step solutions with expert insights and AI powered tools for academic success
Step: 2

Step: 3
Ace Your Homework with AI
Get the answers you need in no time with our AI-driven, step-by-step assistance
Get Started
Re Imagining Offshore Finance
Authors: Christopher M. Bruner
1st Edition
0190466871, 978-0190466879