

Answered step by step
Verified Expert Solution
Question
1 Approved Answer
(Expected return, standard deviation, and capital asset pricing model) The following are the end-of-month prices for both the Standard & Poor's 500 Index and Nike's
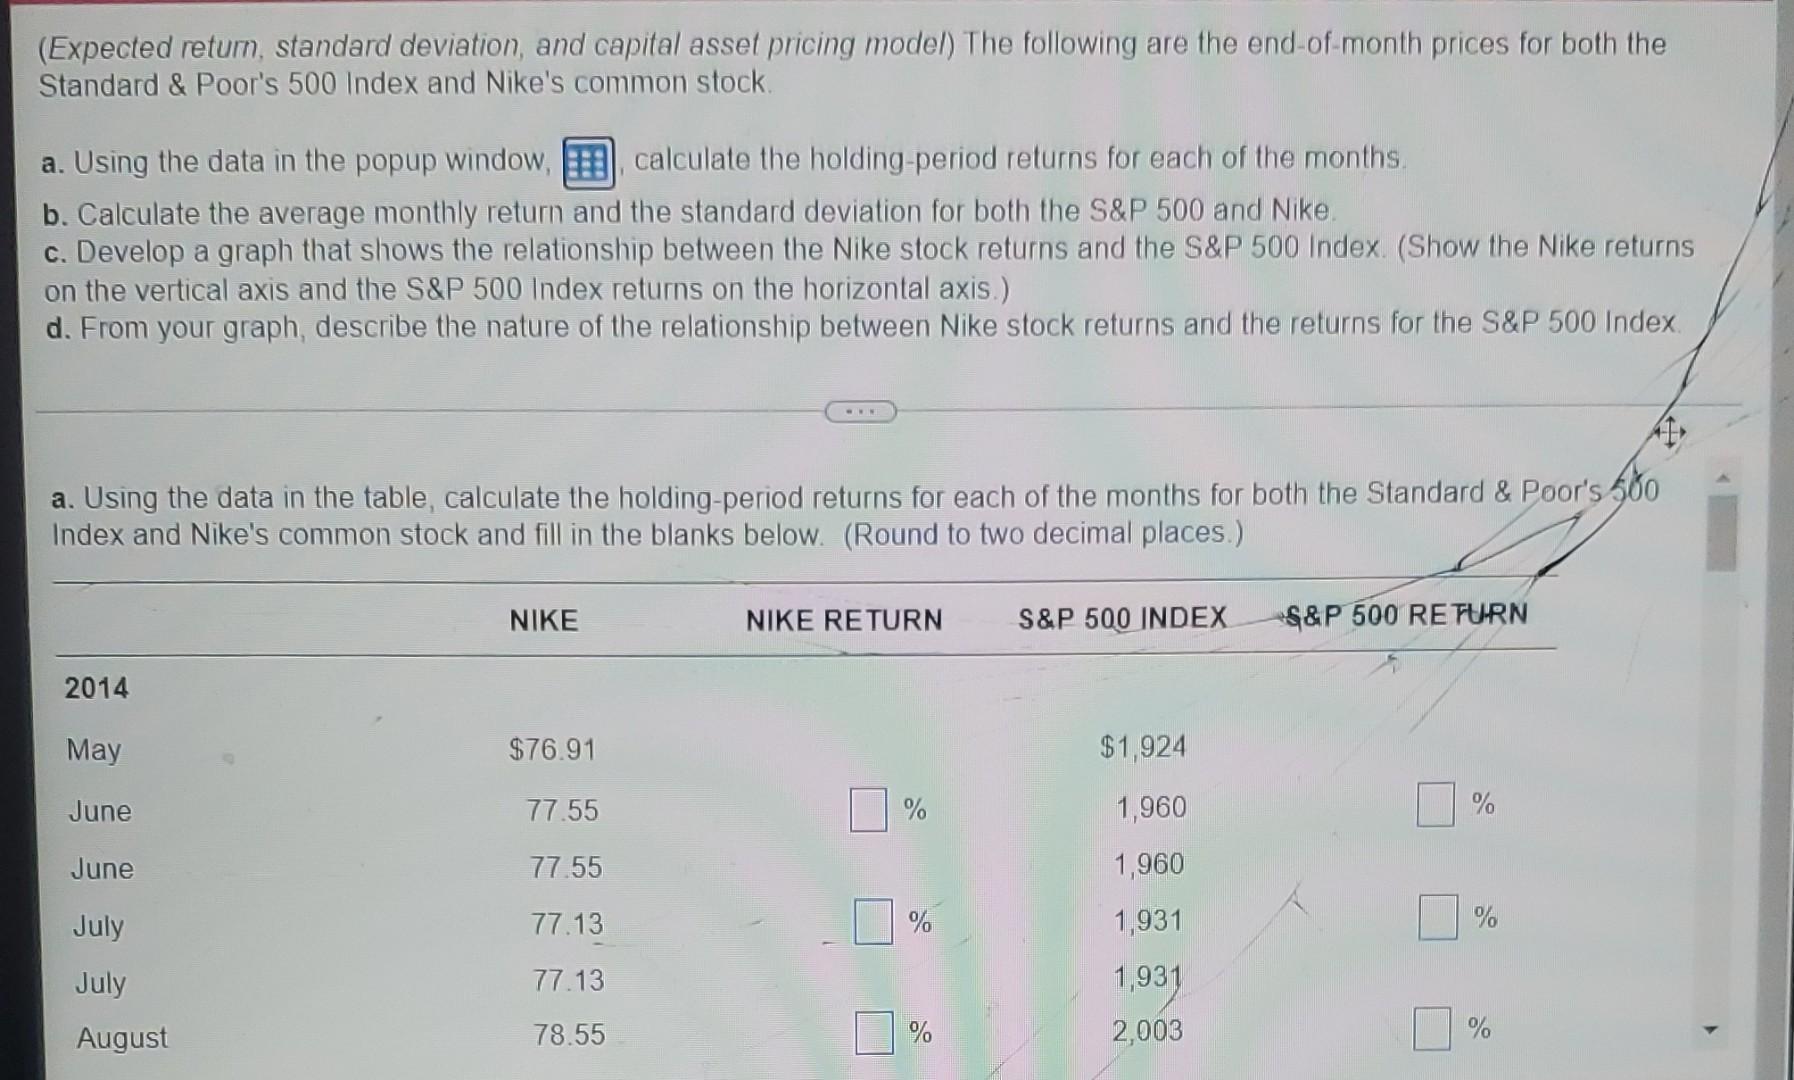
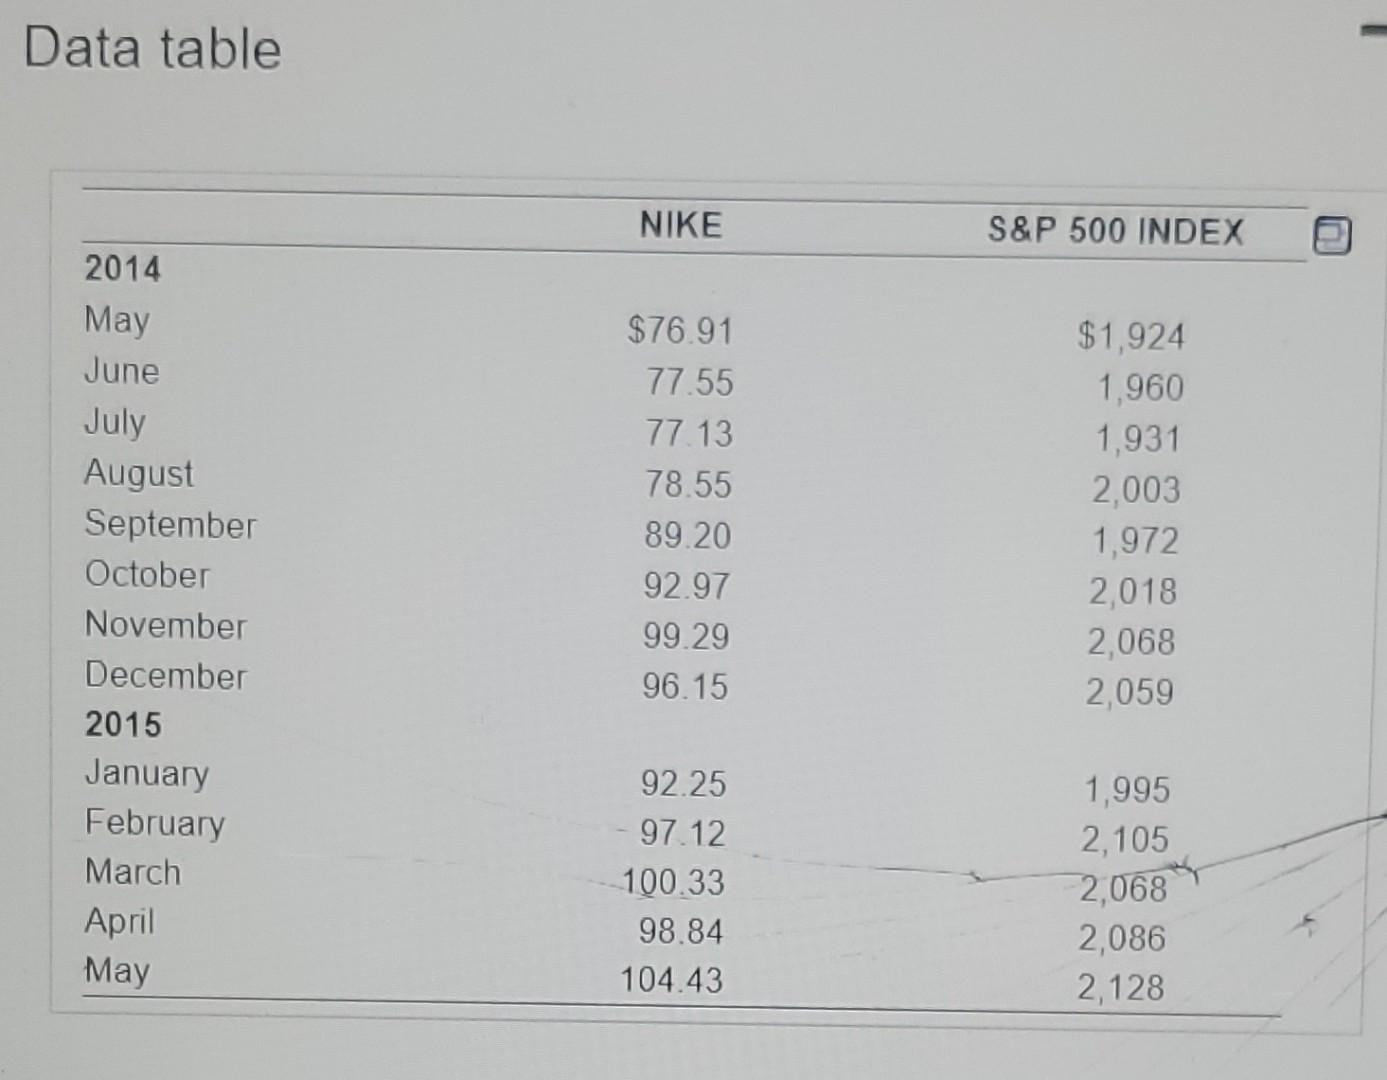
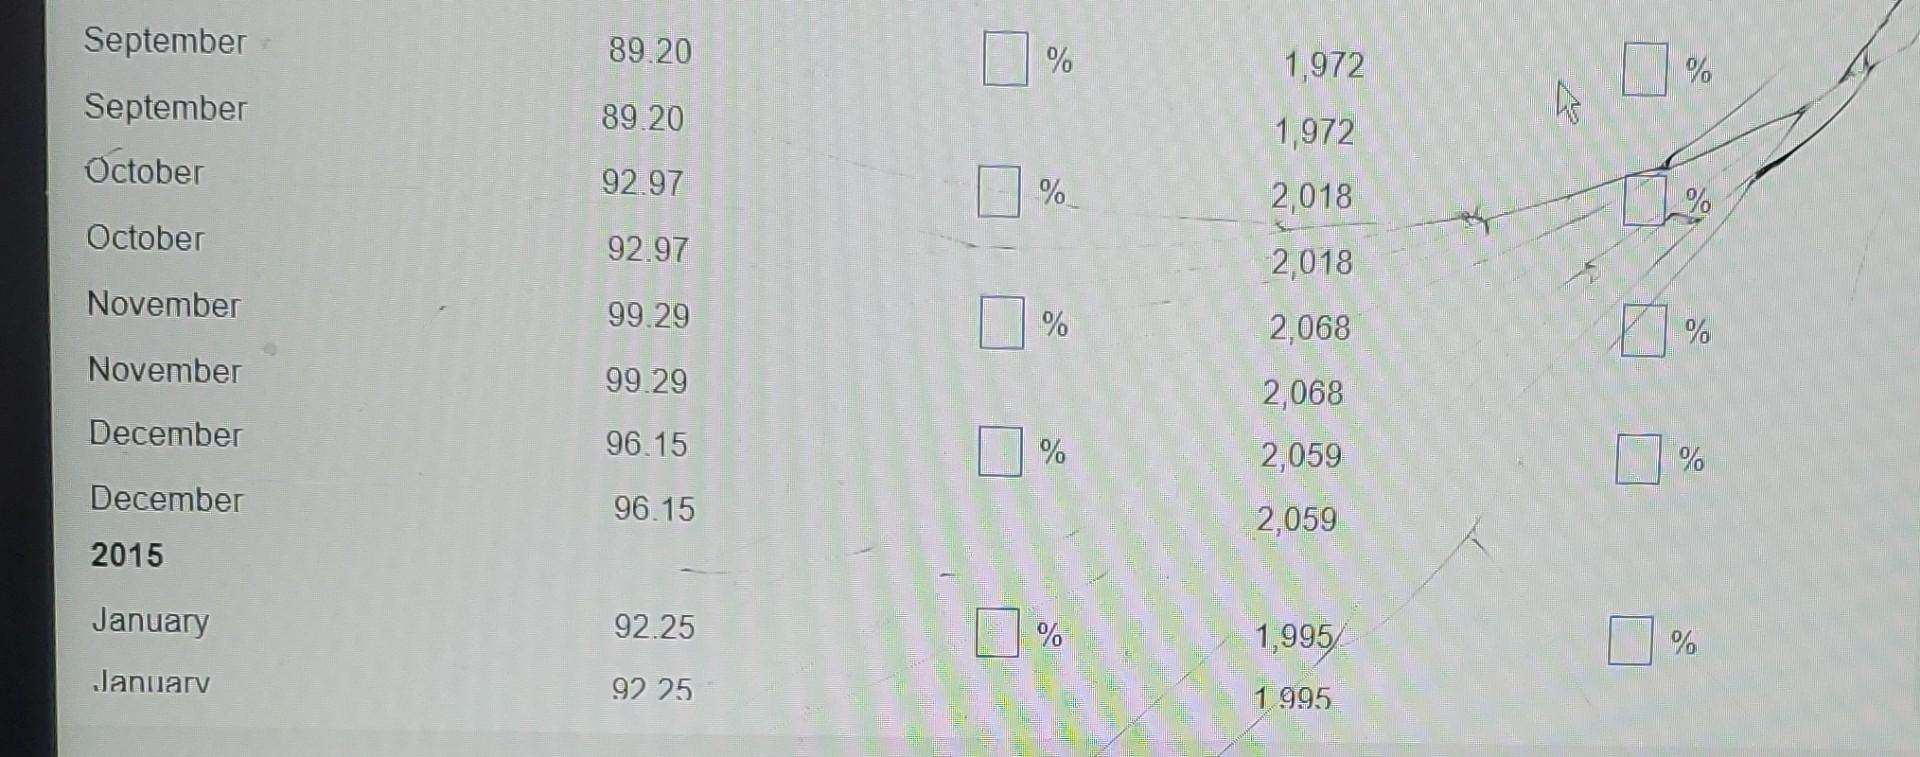
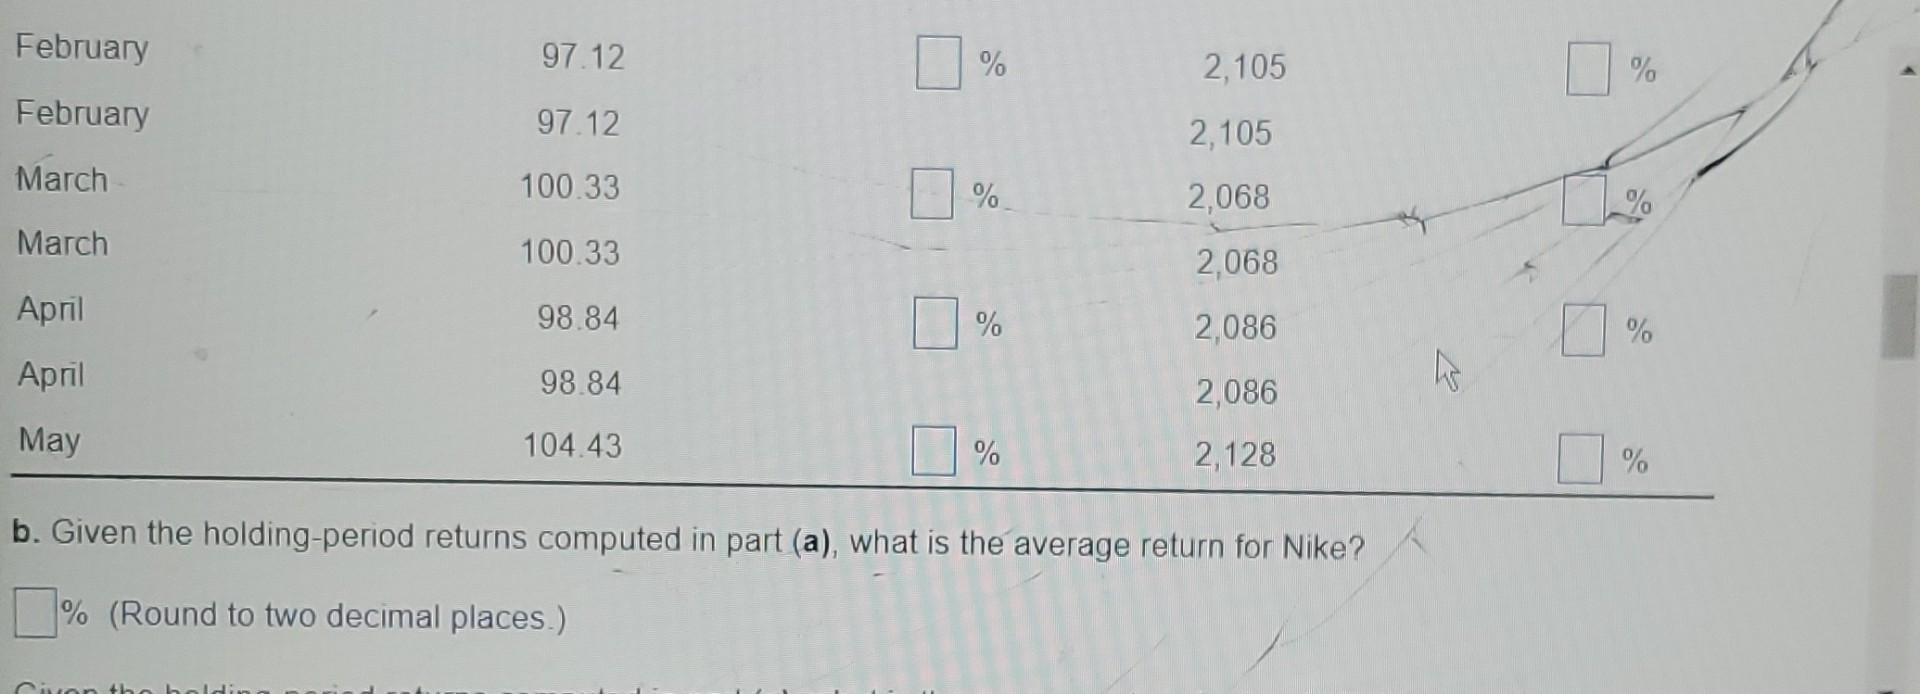
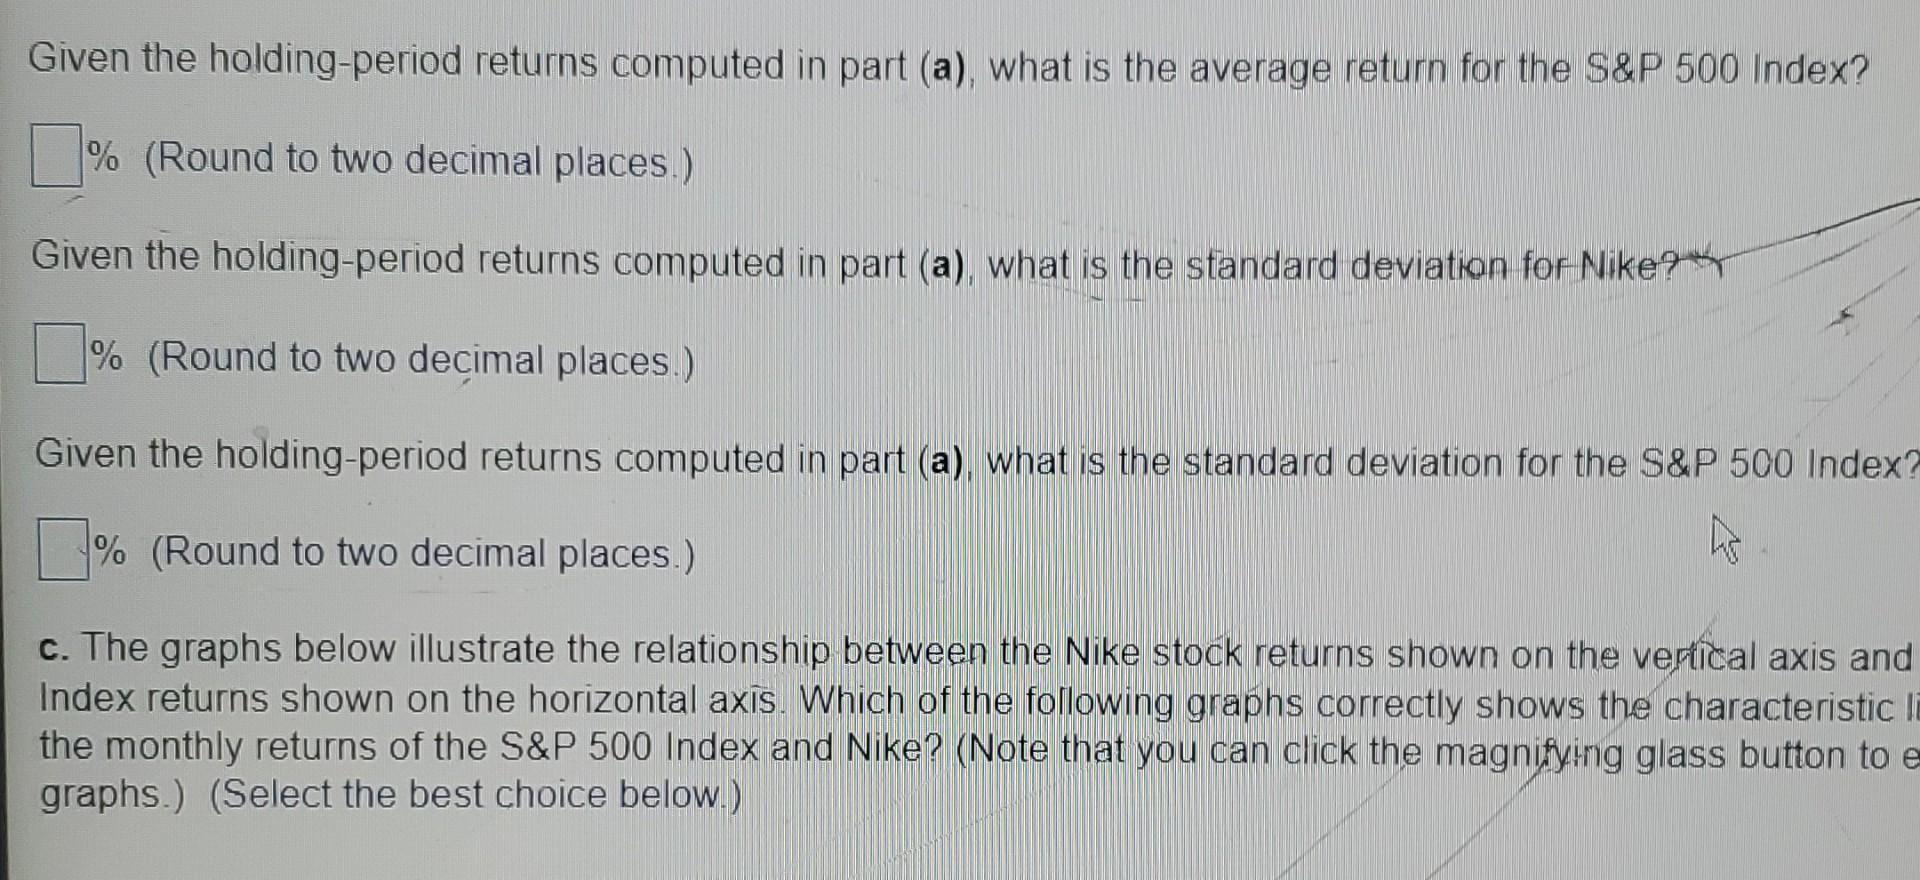
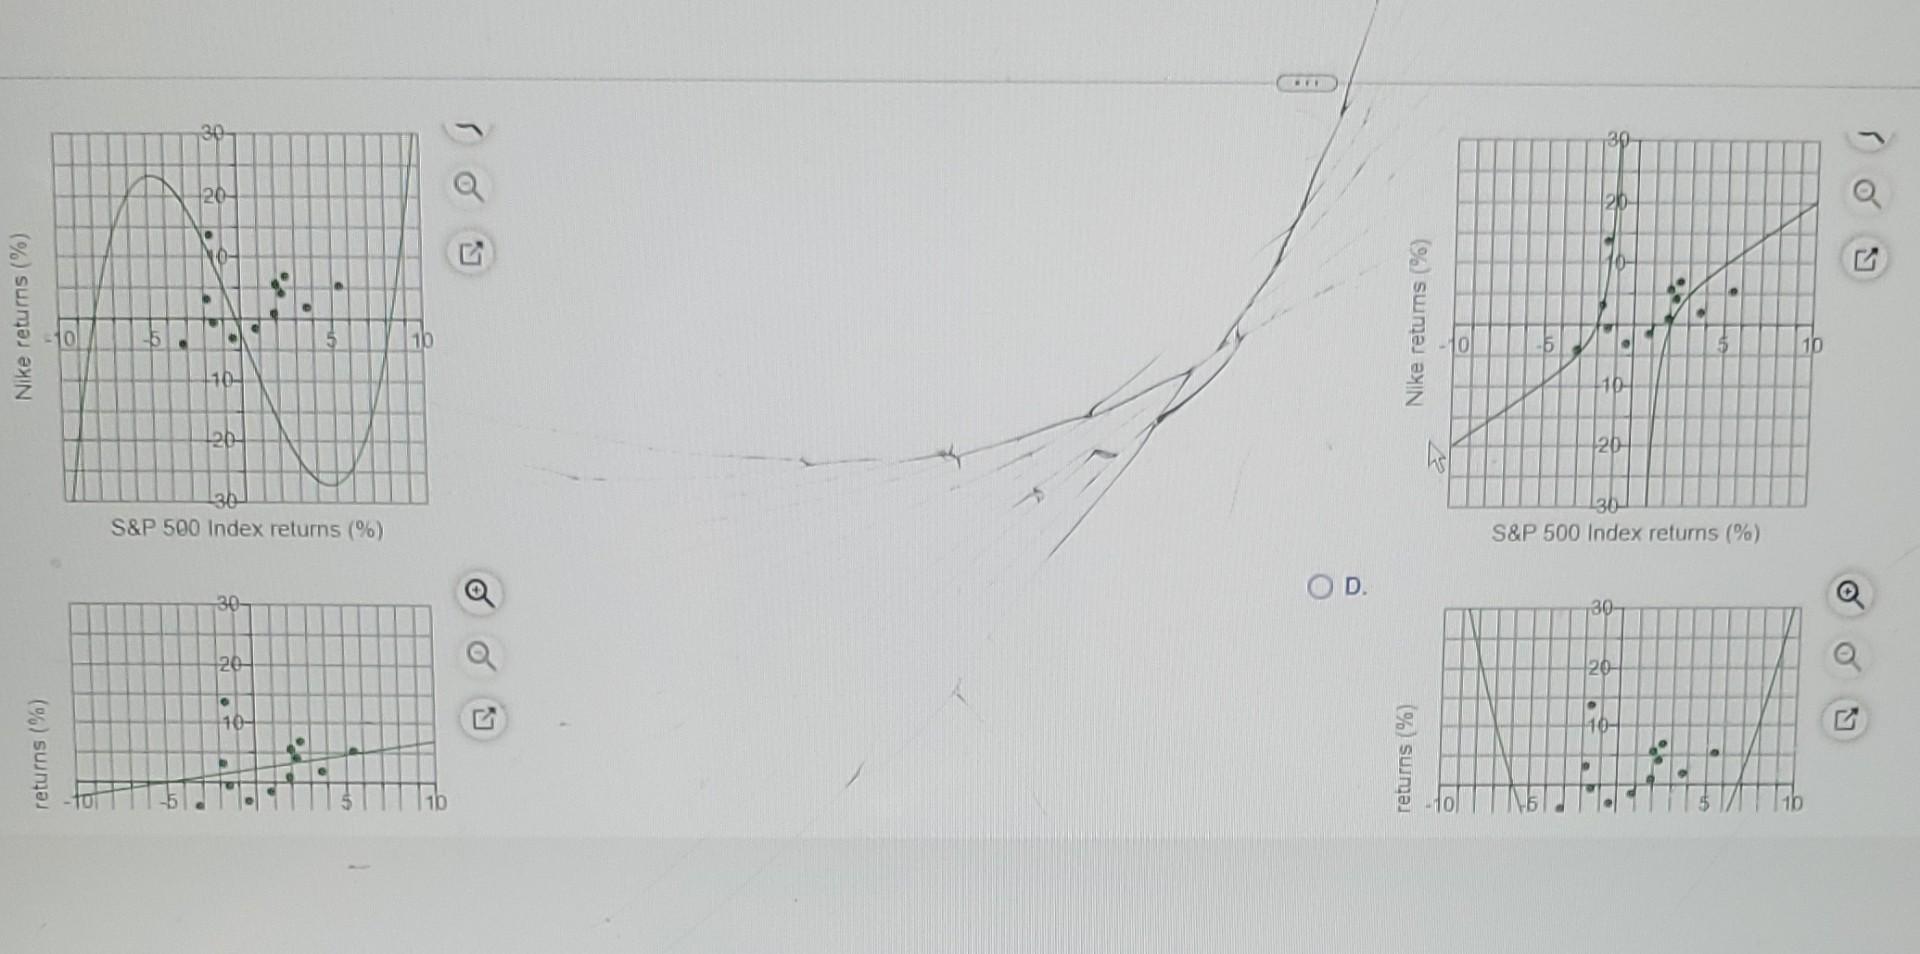
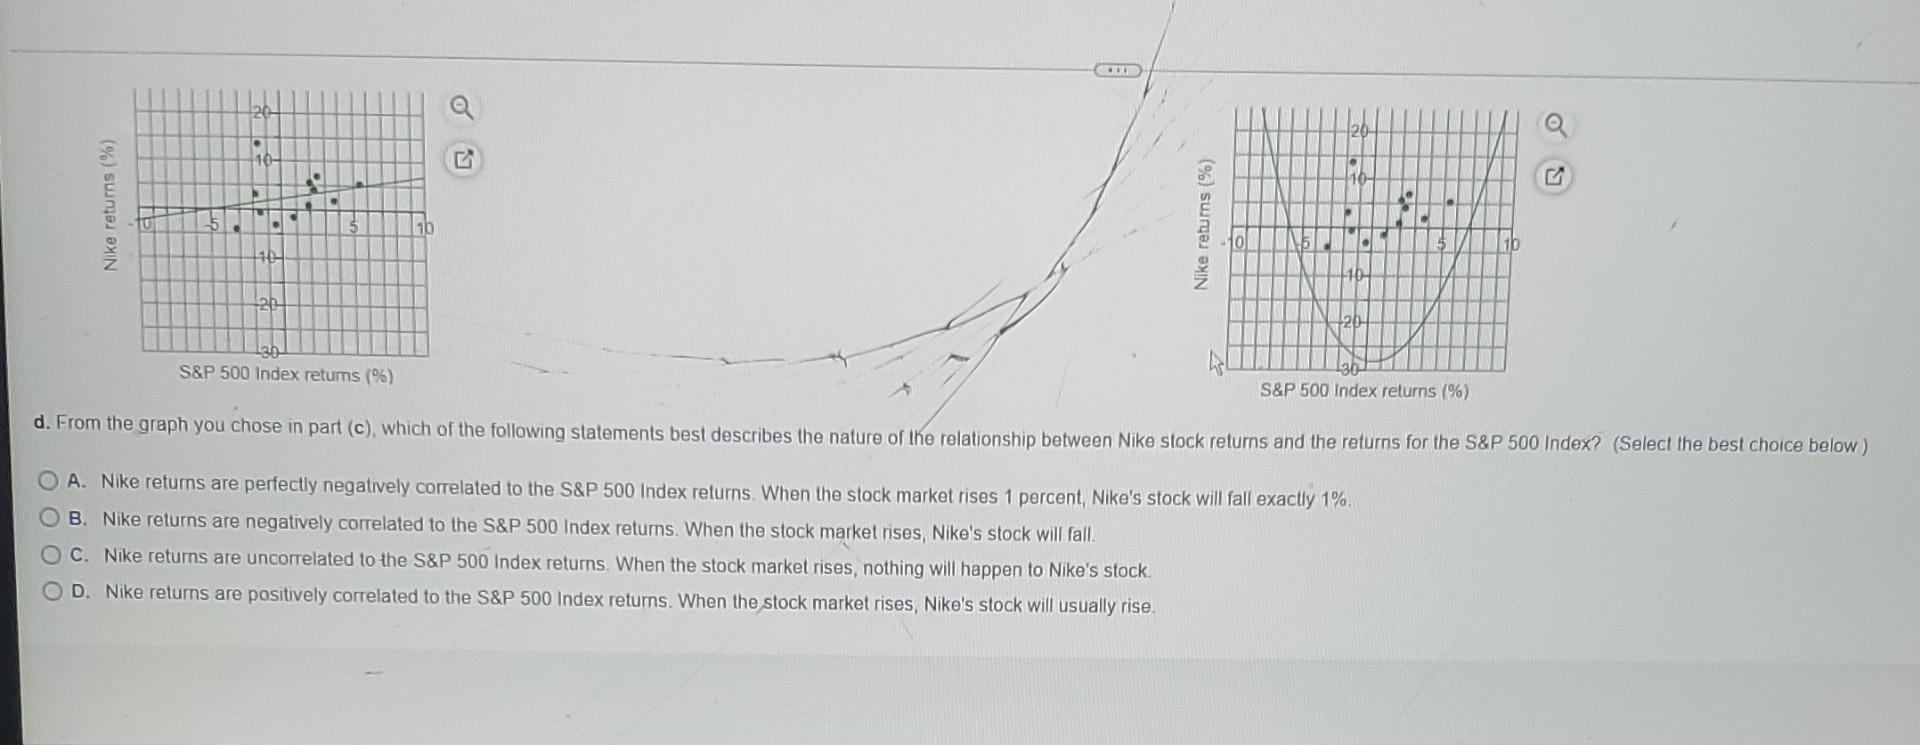
(Expected return, standard deviation, and capital asset pricing model) The following are the end-of-month prices for both the Standard & Poor's 500 Index and Nike's common stock a. Using the data in the popup window, calculate the holding-period returns for each of the months. b. Calculate the average monthly return and the standard deviation for both the S&P 500 and Nike c. Develop a graph that shows the relationship between the Nike stock returns and the S&P 500 Index. (Show the Nike returns on the vertical axis and the S&P 500 Index returns on the horizontal axis.) d. From your graph, describe the nature of the relationship between Nike stock returns and the returns for the S&P 500 Index a. Using the data in the table, calculate the holding-period returns for each of the months for both the Standard & Poor's 500 Index and Nike's common stock and fill in the blanks below. (Round to two decimal places.) NIKE NIKE RETURN S&P 500 INDEX S&P 500 RETURN 2014 May $76.91 $1,924 June 77.55 % 1,960 % June 77.55 1,960 77.13 % 1,931 % July July August 77.13 1,931 2,003 78.55 % % Data table NIKE S&P 500 INDEX 2014 May June July August September October November December 2015 January February March April May $76.91 77.55 77.13 78.55 89.20 92.97 99.29 96.15 $1,924 1,960 1,931 2.003 1,972 2,018 2,068 2,059 92.25 - 97.12 100.33 98.84 104.43 1,995 2,105 2068 2,086 2,128 September 89.20 % 1,972 % 89.20 his September October 1,972 92.97 % 2018 11% October 92.97 November 99.29 2,018 2,068 % 0 % November 99.29 2,068 December 96.15 % 2,059 % December 2015 96.15 2,059 January 92.25 % 1,995 % % January 92 25 1 995 February 97.12 % 2,105 % February 97.12 2,105 March 100 33 % 2,068 March 100.33 2,068 April 98.84 % 2,086 % April 98.84 2,086 May 104.43 % 2,128 % b. Given the holding-period returns computed in part (a), what is the average return for Nike? % (Round to two decimal places.) in the bed Given the holding-period returns computed in part (a), what is the average return for the S&P 500 Index? 1 % (Round to two decimal places.) Given the holding-period returns computed in part (a), what is the standard deviation for Nike? % (Round to two decimal places) Given the holding-period returns computed in part (a), what is the standard deviation for the S&P 500 Index? A % (Round to two decimal places.) c. The graphs below illustrate the relationship between the Nike stock returns shown on the vertical axis and Index returns shown on the horizontal axis. Which of the following graphs correctly shows the characteristic li the monthly returns of the S&P 500 Index and Nike? (Note that you can click the magnifying glass button to e graphs.) (Select the best choice below.) 30 30 a 120- 20 NO- Nike returns (%) Nike returns (%) 10 15 10 110- 10- 126- 20 36 S&P 500 Index returns (%) 30- S&P 500 Index returns (%) D. 30- 30 20- 20- 102 . . returns (%) returns %) D o lo 10 ORT Nike returns (%) 5 . 16 Nike returns (%) 10 10 20 20 S&P 500 Index returns (%) S&P 500 Index returns (%) d. From the graph you chose in part (c), which of the following statements best describes the nature of the relationship between Nike stock retums and the returns for the S&P 500 Index? (Select the best choice below) A. Nike returns are perfectly negatively correlated to the S&P 500 Index returns. When the stock market rises 1 percent, Nike's stock will fall exactly 1%. B. Nike returns are negatively correlated to the S&P 500 Index retums. When the stock market rises, Nike's stock will fall. O C. Nike returns are uncorrelated to the S&P 500 Index returns. When the stock market rises, nothing will happen to Nike's stock. D. Nike returns are positively correlated to the S&P 500 Index returns. When the stock market rises, Nike's stock will usually rise
Step by Step Solution
There are 3 Steps involved in it
Step: 1

Get Instant Access to Expert-Tailored Solutions
See step-by-step solutions with expert insights and AI powered tools for academic success
Step: 2

Step: 3
Ace Your Homework with AI
Get the answers you need in no time with our AI-driven, step-by-step assistance
Get Started
Pandemonium The Great Indian Banking Tragedy
Authors: Tamal Bandyopadhyay
1st Edition
819464335X, 8194643368, 9788194643364