2. Experiment: Randomly select the heights of at least 15 of the students in your class. a. Develop a control chart and plot the heights

2. Experiment: Randomly select the heights of at least 15 of the students in your class.
a. Develop a control chart and plot the heights on the chart.
b. Which chart should you use?
c. Is this process in control?
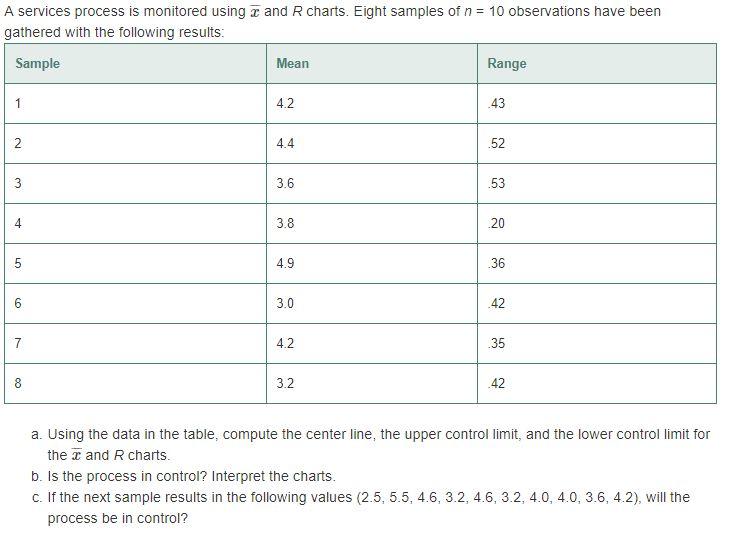
A services process is monitored using z and R charts. Eight samples of n = 10 observations have been gathered with the following results: Sample Mean Range 1 4.2 43 2 4.4 52 3.6 53 3.8 4.9 36 6. 3.0 42 7 4.2 35 8 3.2 42 a. Using the data in the table, compute the center line, the upper control limit, and the lower control limit for the z and R charts. b. Is the process in control? Interpret the charts. c. If the next sample results in the following values (2.5, 5.5, 4.6, 3.2, 4.6, 3.2, 4.0, 4.0, 3.6, 4.2), will the process be in control? 20 3. 4. LO
Step by Step Solution
3.46 Rating (166 Votes )
There are 3 Steps involved in it
Step: 1
n 10 X bar Range Sample Mean Range 1 42 043 2 44 052 ...
See step-by-step solutions with expert insights and AI powered tools for academic success
Step: 2

Step: 3

Ace Your Homework with AI
Get the answers you need in no time with our AI-driven, step-by-step assistance
Get Started


