Answered step by step
Verified Expert Solution
Link Copied!

Question

1 Approved Answer

Explain in short . Consider the graph of a call option shown at right. The option is a three-month call option on 62,500 with a

Explain in short

image text in transcribed

. Consider the graph of a call option shown at right. The option is a three-month call option on 62,500 with a strike price of $1.50/ and an option premium of $3,125. What are the values of A, B, and C, respectively? Note that A is the profit or loss; B and C are the spot prices. Profit A SI 1 loss

Step by Step Solution

There are 3 Steps involved in it

Step: 1

blur-text-image

Get Instant Access to Expert-Tailored Solutions

See step-by-step solutions with expert insights and AI powered tools for academic success

Step: 2

blur-text-image_2

Step: 3

blur-text-image_3

Ace Your Homework with AI

Get the answers you need in no time with our AI-driven, step-by-step assistance

Get Started

Recommended Textbook for

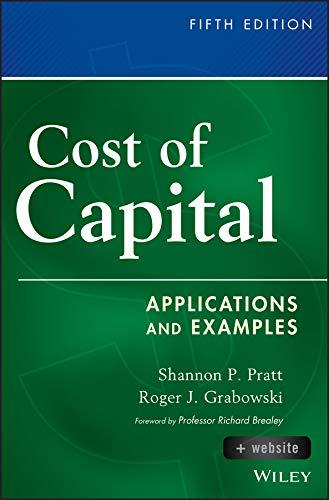
Cost Of Capital Applications And Examples

Authors: Shannon P. Pratt, Roger J. Grabowski, Richard A. Brealey

5th Edition

1118555805, 9781118555804

More Books

Students also viewed these Finance questions

Question

Discuss the importance of identifying the acquisition date.

Answered: 1 week ago

Question

What is the competition?

Answered: 1 week ago

Question

What is the relative priority among the viable goals?

Answered: 1 week ago