

Explain. step by step the following questions.
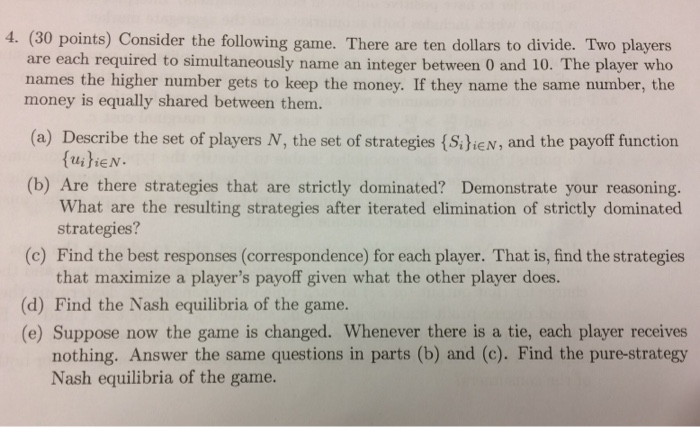
) Determine the inverse demand function. 0) Determine the vertical intercept of the inverse demand function. )Determine the horizontal intercept of the inverse demand function. d) Determine the slope of the inverse demand function. 2) Draw the consumer's inverse demand curve in Figure 1 provided in the answer booklet. Determine the market demand curve if there are 1000 consumers with the demand function Q = 40 - 5P 2) The demand functions for consumers 1, 2, and 3 are respectively Q1 = 60 - P, Q2 = 80 - 2P, and Q3 = 80 4P ) Determine the inverse demand function for each consumer. 0) Determine the vertical intercept for each inverse demand function. Determine the horizontal intercept for each inverse function. d) Determine the slope for each inverse demand function. 2) Determine the market demand curve. Draw the inverse market demand curve in Figure 2 provided in the answer booklet. 8) A consumer's demand function for good x is Qx = 8 - Px - Py/2 + 1/100 with Ox representing the quantity demand for good x, Px the price for good x, Py the price for good y, and I the consumer's income. ) Draw the inverse demand curve in Figure 3 provided in the answer booklet if Py = 2 and I = 100. 0) Draw the inverse demand curve in Figure 3 provided in the answer booklet if Py increases from 2 to 4 and I = 100. () Draw the inverse demand curve in Figure 3 provided in the answer booklet if I increases from 100 to 200 and Py = 2 1) A consumer's demand function for good x is @x = 50 - Px + 3Py/2 - Pz + 1/125 with Qx representing the quantity demand for good x, Px the price for good x, Py the price for good y, Pz the price for good z, and I the consumer's income.4. (30 points) Consider the following game. There are ten dollars to divide. Two players are each required to simultaneously name an integer between 0 and 10. The player who names the higher number gets to keep the money. If they name the same number, the money is equally shared between them. (a) Describe the set of players N, the set of strategies { Silien, and the payoff function QuitiEN. (b) Are there strategies that are strictly dominated? Demonstrate your reasoning. What are the resulting strategies after iterated elimination of strictly dominated strategies? (c) Find the best responses (correspondence) for each player. That is, find the strategies that maximize a player's payoff given what the other player does. (d) Find the Nash equilibria of the game. (e) Suppose now the game is changed. Whenever there is a tie, each player receives nothing. Answer the same questions in parts (b) and (c). Find the pure-strategy Nash equilibria of the game.(3) You and a classmate are assigned a project on which you will receive one combined grade. You each want to receive a good grade, but you also want to avoid hard work. In particular, here is the situation: If you both work hard, you get an A, which gives you each 40 units of happiness .If only one of you works hard, you both get a B, which gives you each 30 units of happiness. .If neither of you works hard, you both get a D, which gives each of you 10 units of happiness. . Working hard costs 25 units of happiness. (a) Fill in the following payoff matrix: Your decision Work Shirk Classmate's Work decision Shirk (b) What is the likely outcome? Explain your answer. T (c) If you get this classmate as your partner on a series of projects throughout the year, rather than only once, how might that change the outcome you predicted in part (b)?Consider the following annual model of the death rate (per million population) due to coronary heart disease in the U.S. (denoted by Y.): Y, =140+ 10.0C, +4.0E, -1.0M, +e, (2.5) (1.0) (0.5) N = 31 Standard errors are in parentheses where C = per capita cigarette consumption (pounds of tobacco) in year t Et = per capita consumption of edible saturated fats (pounds per butter, margarine) in year t M. = per capita consumption of meat (pounds) in year t a) Do the coefficient estimates in the regression above have the expected sign? I.e. do you expect Bc to be positive, BE to be positive, and By to be negative? Explain. b) Calculate the t-statistic for every coefficient estimate. Assume that the critical t-value for a two- sided test of statistical significance at the 5 percent level is 2.056. Is Ct, Et, or M, statistically significant? c) The most likely cause of a coefficient that is significant in the unexpected direction is omitted variable bias. Which of the variables listed below could possibly be an omitted variable that is causing PM's unexpected sign? (Hint: Use the table below for your answer). Corr (X1,X2) > 0 Corr (X1,X2) 0 Positive bias Negative bias Bomitted