
Explain the following in this question is complete
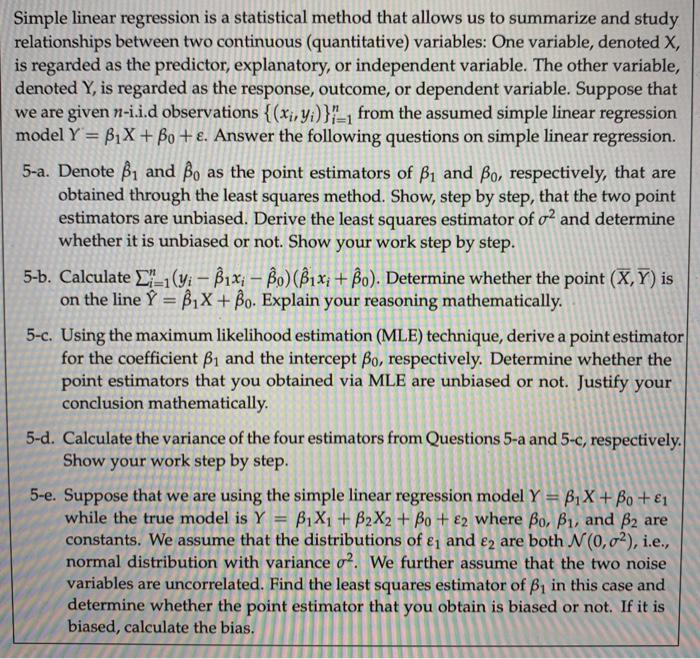
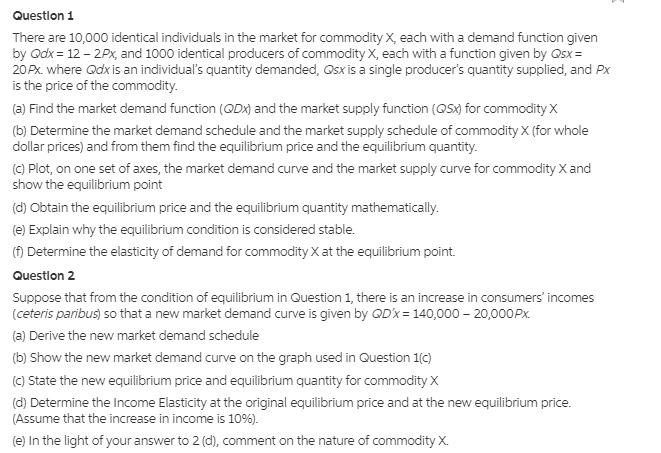
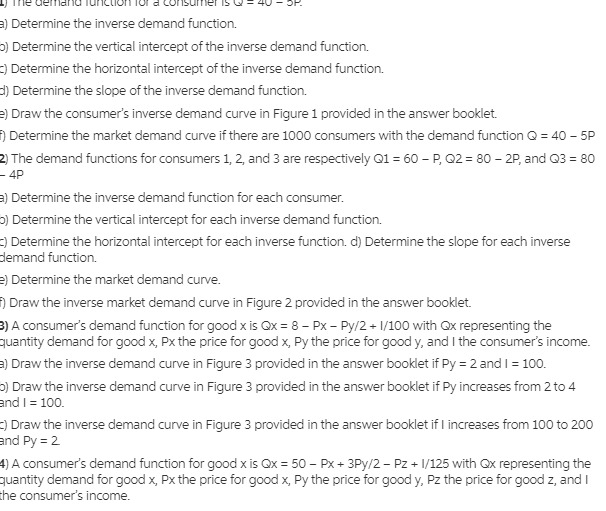
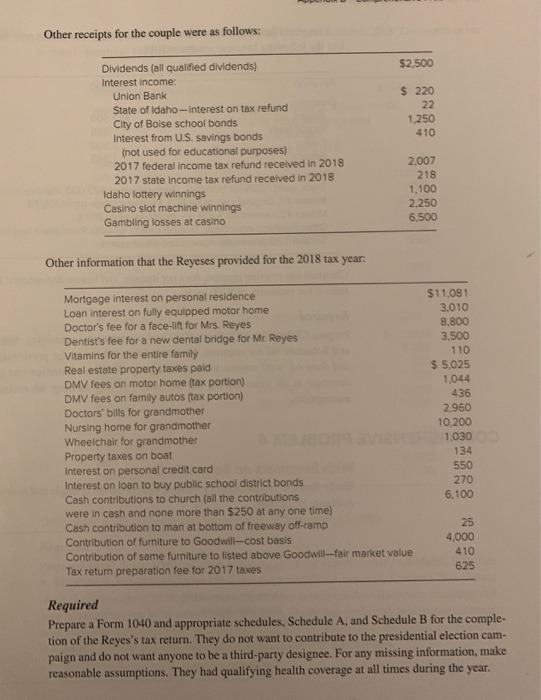
Simple linear regression is a statistical method that allows us to summarize and study relationships between two continuous (quantitative) variables: One variable, denoted X, is regarded as the predictor, explanatory, or independent variable. The other variable, denoted Y, is regarded as the response, outcome, or dependent variable. Suppose that we are given n-i.i.d observations { (x;, y;)}"_, from the assumed simple linear regression model Y = BIX + Bo + . Answer the following questions on simple linear regression. 5-a. Denote 1 and Bo as the point estimators of B, and Bo, respectively, that are obtained through the least squares method. Show, step by step, that the two point estimators are unbiased. Derive the least squares estimator of of and determine whether it is unbiased or not. Show your work step by step. 5-b. Calculate _'_1(yi - Bix; - Bo) (Bix, + Bo). Determine whether the point (X, Y) is on the line Y = 1X + Bo. Explain your reasoning mathematically. 5-c. Using the maximum likelihood estimation (MLE) technique, derive a point estimator for the coefficient B1 and the intercept Bo, respectively. Determine whether the point estimators that you obtained via MLE are unbiased or not. Justify your conclusion mathematically. 5-d. Calculate the variance of the four estimators from Questions 5-a and 5-c, respectively. Show your work step by step. 5-e. Suppose that we are using the simple linear regression model Y = B1 X + Bo + 1 while the true model is Y = 1X1 + B2X2 + Bo + 82 where Bo, B1, and B2 are constants. We assume that the distributions of &, and e2 are both N(0,02), i.e., normal distribution with variance o?. We further assume that the two noise variables are uncorrelated. Find the least squares estimator of B, in this case and determine whether the point estimator that you obtain is biased or not. If it is biased, calculate the bias.Question 1 There are 10,000 identical individuals in the market for commodity X, each with a demand function given by Qodx = 12 - 2Px, and 1000 identical producers of commodity X, each with a function given by Qsx = 20 Px. where Qox is an individual's quantity demanded, Qsx is a single producer's quantity supplied, and Px is the price of the commodity. (a) Find the market demand function (QDx) and the market supply function (QSx) for commodity X (b) Determine the market demand schedule and the market supply schedule of commodity X (for whole dollar prices) and from them find the equilibrium price and the equilibrium quantity. (c) Plot, on one set of axes, the market demand curve and the market supply curve for commodity X and show the equilibrium point (d) Obtain the equilibrium price and the equilibrium quantity mathematically. (e) Explain why the equilibrium condition is considered stable. (f) Determine the elasticity of demand for commodity X at the equilibrium point. Question 2 Suppose that from the condition of equilibrium in Question 1, there is an increase in consumers' incomes (ceteris paribus) so that a new market demand curve is given by QDx = 140,000 - 20,000Px. (a) Derive the new market demand schedule (b) Show the new market demand curve on the graph used in Question 1(c) (c) State the new equilibrium price and equilibrium quantity for commodity X (d) Determine the Income Elasticity at the original equilibrium price and at the new equilibrium price. (Assume that the increase in income is 106). (e) In the light of your answer to 2 (d), comment on the nature of commodity X.) Determine the inverse demand function. 0) Determine the vertical intercept of the inverse demand function. )Determine the horizontal intercept of the inverse demand function. d) Determine the slope of the inverse demand function. 2) Draw the consumer's inverse demand curve in Figure 1 provided in the answer booklet. Determine the market demand curve if there are 1000 consumers with the demand function Q = 40 - 5P 2) The demand functions for consumers 1, 2, and 3 are respectively Q1 = 60 - P, Q2 = 80 - 2P, and Q3 = 80 4P ) Determine the inverse demand function for each consumer. 0) Determine the vertical intercept for each inverse demand function. Determine the horizontal intercept for each inverse function. d) Determine the slope for each inverse demand function. 2) Determine the market demand curve. Draw the inverse market demand curve in Figure 2 provided in the answer booklet. 8) A consumer's demand function for good x is Qx = 8 - Px - Py/2 + 1/100 with Ox representing the quantity demand for good x, Px the price for good x, Py the price for good y, and I the consumer's income. ) Draw the inverse demand curve in Figure 3 provided in the answer booklet if Py = 2 and I = 100. 0) Draw the inverse demand curve in Figure 3 provided in the answer booklet if Py increases from 2 to 4 and I = 100. () Draw the inverse demand curve in Figure 3 provided in the answer booklet if I increases from 100 to 200 and Py = 2 1) A consumer's demand function for good x is @x = 50 - Px + 3Py/2 - Pz + 1/125 with Qx representing the quantity demand for good x, Px the price for good x, Py the price for good y, Pz the price for good z, and I the consumer's income.Other receipts for the couple were as follows: Dividends (all qualified dividends) $2.500 Interest income: Union Bank $ 220 State of Idaho-interest on tax refund 22 City of Boise school bonds 1.250 Interest from U.S. savings bonds 410 (not used for educational purposes) 2017 federal income tax refund received in 2018 2,007 2017 state income tax refund received in 2018 218 Idaho lottery winnings 1.100 Casino slot machine winnings 2,250 Gambling losses at casino 6.500 Other information that the Reyeses provided for the 2018 tax year. Mortgage interest on personal residence $11.081 Loan interest on fully equipped motor home 3.010 Doctor's fee for a face-lift for Mrs. Reyes 8.800 Dentist's fee for a new dental bridge for Mr. Reyes 3,500 Vitamins for the entire family 1 10 Real estate property taxes paid $ 5,025 DMV fees on motor home (tax portion) 1.044 DMV fees on family autos (tax portion) 436 Doctors' bills for grandmother 2,960 Nursing home for grandmother 10,200 Wheelchair for grandmother 1.030 Property taxes on boat 134 Interest on personal credit card 550 Interest on loan to buy public school district bonds 270 Cash contributions to church (all the contributions 6.100 were in cash and none more than $250 at any one time) Cash contribution to man at bottom of freeway off-ramp 25 Contribution of furniture to Goodwill-cost basis 4,000 Contribution of same furniture to listed above Goodwill-fair market value 410 Tax return preparation fee for 2017 taxes 625 Required Prepare a Form 1040 and appropriate schedules, Schedule A, and Schedule B for the comple- tion of the Reyes's tax return. They do not want to contribute to the presidential election cam- paign and do not want anyone to be a third-party designee. For any missing information, make reasonable assumptions. They had qualifying health coverage at all times during the year.vi payments accounts, still PLEsuit IsOnly foreign currency traded with the Canadian dollar. 7. For each of the following situations, outline the effect on the price of the Canadian dollar in terms of US dollars and draw a demand and supply graph that illustrates the changes that occur in the foreign exchange market for the Canadian dollar. . A contractionary monetary policy initiated by the Bank of Canada raises Canadian interest rates. b. Canada's real output rises at a time when real output in the United States is falling. c. Americans (but not Canadians) find Canada a more attractive place to make financial investments. d. Given Canada's aging population, more Canadian "snowbirds" travel to the United States each winter. e. Due to a credit crisis that affects US financial institutions more than it does Canadian ones, Canada's attractiveness as a destination for direct and portfolio investment increases. f. The Bank of Canada initiates an expansionary monetary policy that reduces Canadian interest rates