

Question
Exploring Histograms with StatCrunch In this activity, you will use StatCrunch to make several different histograms and explore how the starting point and bin width
Exploring Histograms with StatCrunch
In this activity, you will use StatCrunch to make several different histograms and explore how the starting point and bin width affect the look of the histogram. You will make a histogram that you think represents the data set well. You will also construct one histogram that you think is not a good representation and explain why it is not.
- Choose a data set.
- In StatCrunch, open the data set that contains your class data from the Student Data Survey in chapter one or open another data set as directed by your instructor. Or, open any data set of your choice. You may explore data sets available in StatCrunch by selecting Explore > Data from the StatCrunch homepage.
- Choose a variable from the data set that you would like to explore. Variable selected: __________________
- Make a histogram.
- With your data set open in the StatCrunch spreadsheet, open the Histogram with Sliders
- Applet by selecting Applets > Histogram with Sliders.
- Choose your variable when asked to select a column.
- Select Compute!.
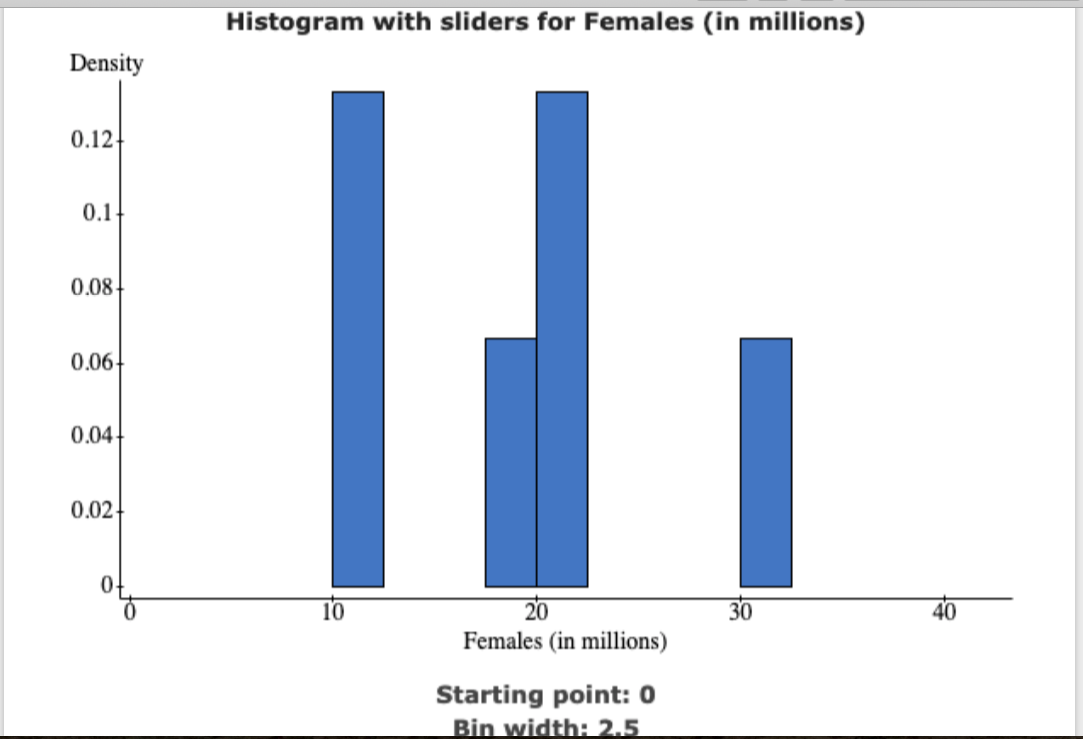
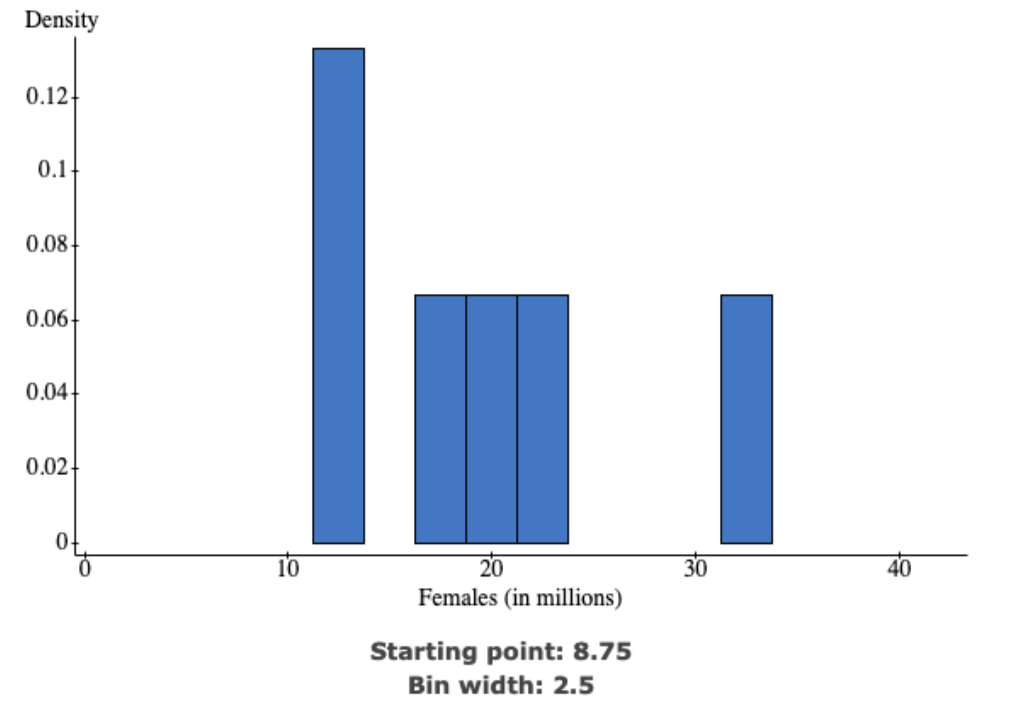
- Explore the effect of changing the starting point for the histogram.
- The Starting point on the histogram applet is_____________________ the for the frequency distribution.
- Place your mouse cursor on the Starting point slider. Change the starting point while watching the effect this has on the histogram.
- By changing the starting point, make at least two histograms that have very different shapes. Print each histogram and attach them here in the space provided. Comment on the shape that each histogram implies for the distribution of your variable.____________________________________________________
16 Exploring Histograms with StatCrunch
4. Explore the effect of changing the bin width for the histogram.
- The Bin width on the histogram applet is the for the frequency distribution_____________________________________________
Step by Step Solution
There are 3 Steps involved in it
Step: 1

Get Instant Access to Expert-Tailored Solutions
See step-by-step solutions with expert insights and AI powered tools for academic success
Step: 2

Step: 3
Ace Your Homework with AI
Get the answers you need in no time with our AI-driven, step-by-step assistance
Get Started
Precalculus
Authors: Michael Sullivan
9th edition
321716835, 321716833, 978-0321716835