Answered step by step
Verified Expert Solution
Link Copied!

Question

1 Approved Answer

Extra Credit (3 points) For the cash flow diagram shown below, determine the uniform annual amount (A) over the 10 year time period (first amount

image text in transcribed

Extra Credit (3 points) For the cash flow diagram shown below, determine the uniform annual amount (A) over the 10 year time period (first amount starting at end of year 1 and last amount at end of year 10) that is equivalent to the cash flows shown. Assume an annual interest rate of 12%. Use at least one uniform gradient factor in your solution. $700 $700 $700 $600 $575 $550 $525 $500 2 3 3 4 5 5 6 7 8 9 10 $70 $50 Extra Credit (3 points) For the cash flow diagram shown below, determine the uniform annual amount (A) over the 10 year time period (first amount starting at end of year 1 and last amount at end of year 10) that is equivalent to the cash flows shown. Assume an annual interest rate of 12%. Use at least one uniform gradient factor in your solution. $700 $700 $700 $600 $575 $550 $525 $500 2 3 3 4 5 5 6 7 8 9 10 $70 $50

Step by Step Solution

There are 3 Steps involved in it

Step: 1

blur-text-image

Get Instant Access to Expert-Tailored Solutions

See step-by-step solutions with expert insights and AI powered tools for academic success

Step: 2

blur-text-image

Step: 3

blur-text-image

Ace Your Homework with AI

Get the answers you need in no time with our AI-driven, step-by-step assistance

Get Started

Recommended Textbook for

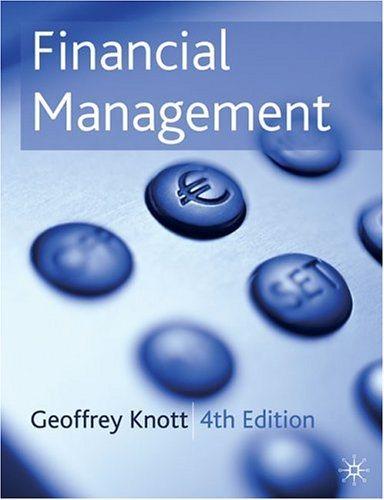
Financial Management

Authors: Geoffrey Knott

4th Edition

1403903824, 9781403903822

More Books

Students also viewed these Finance questions