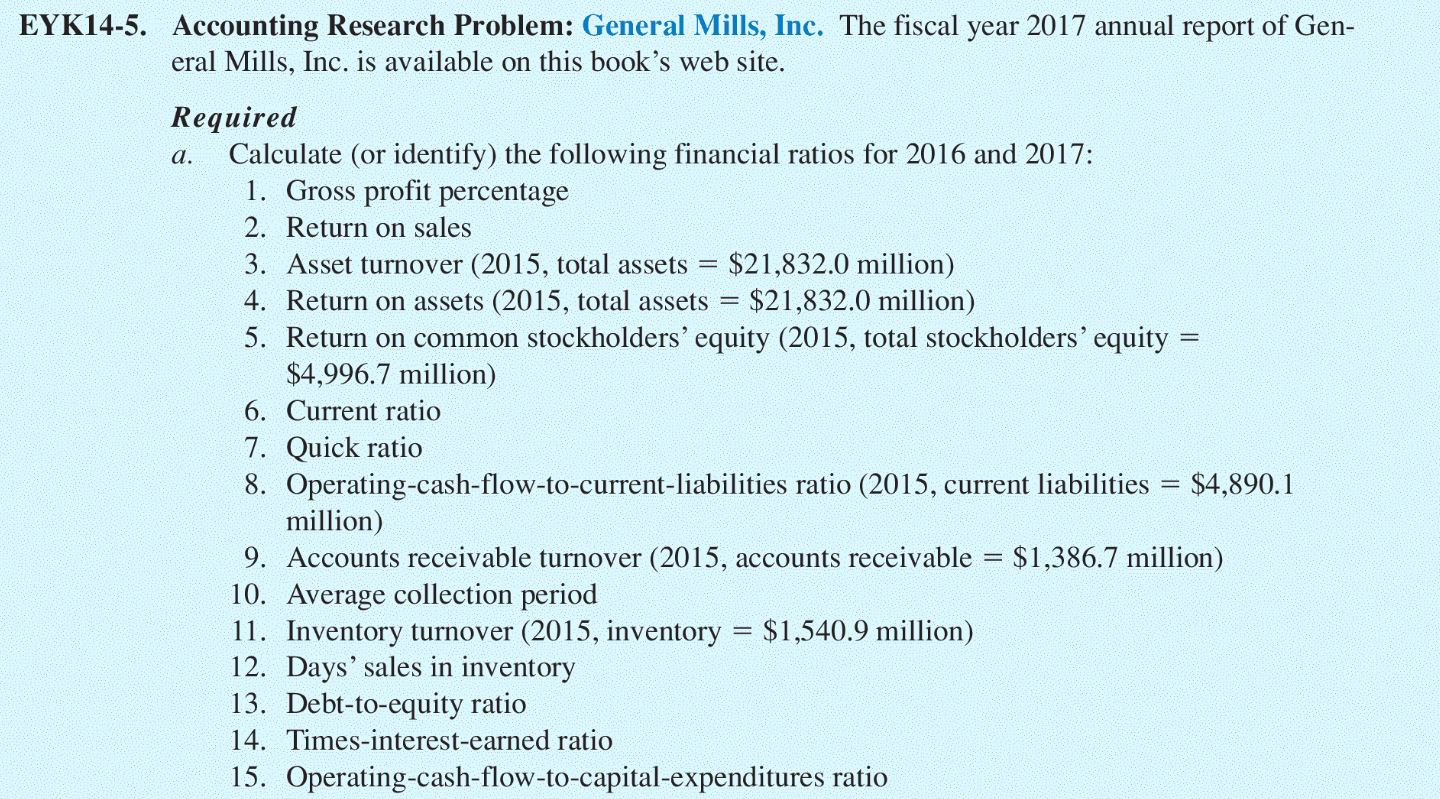
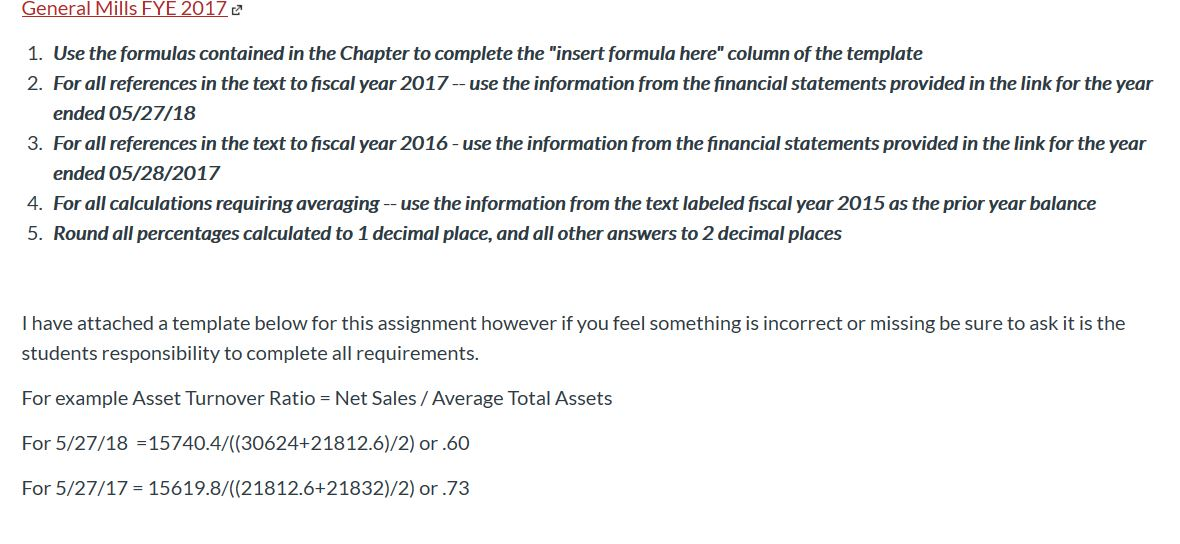
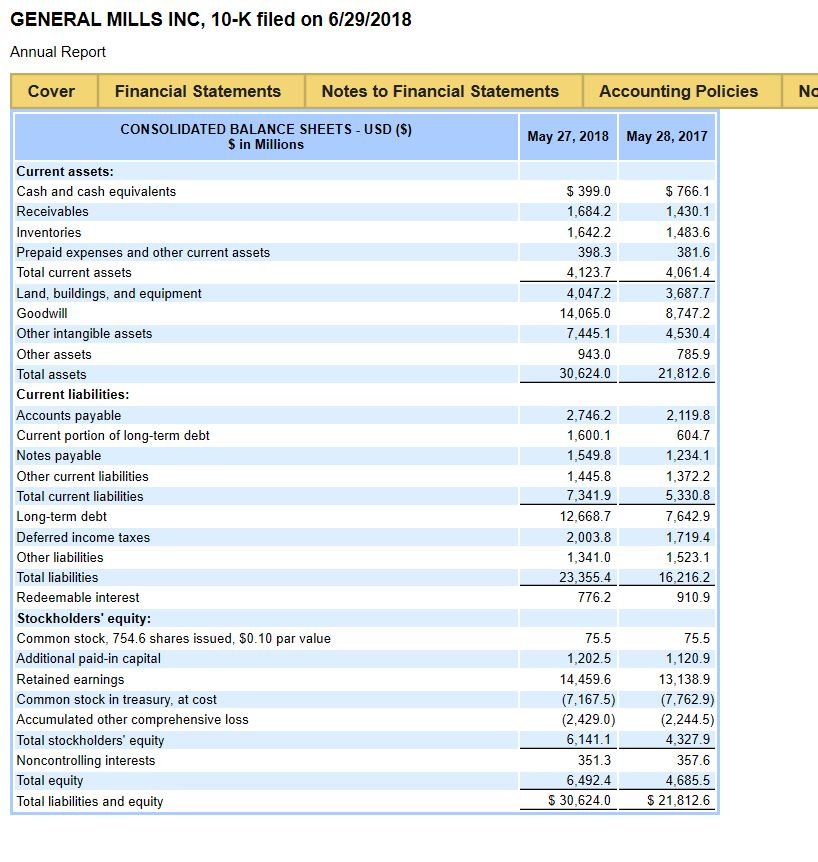
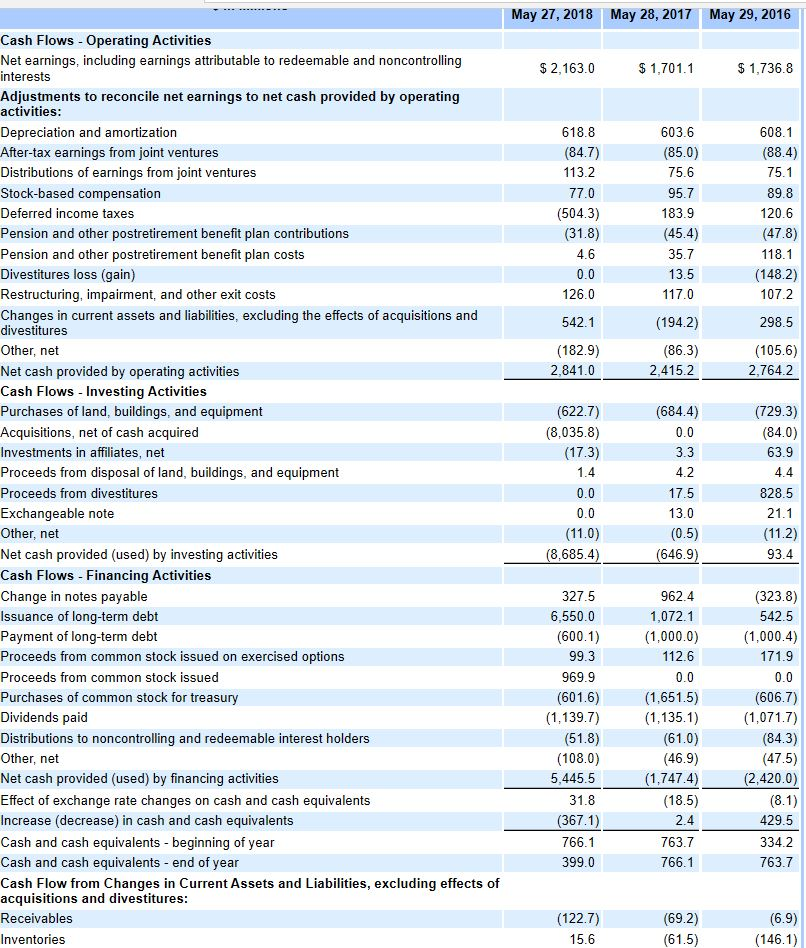
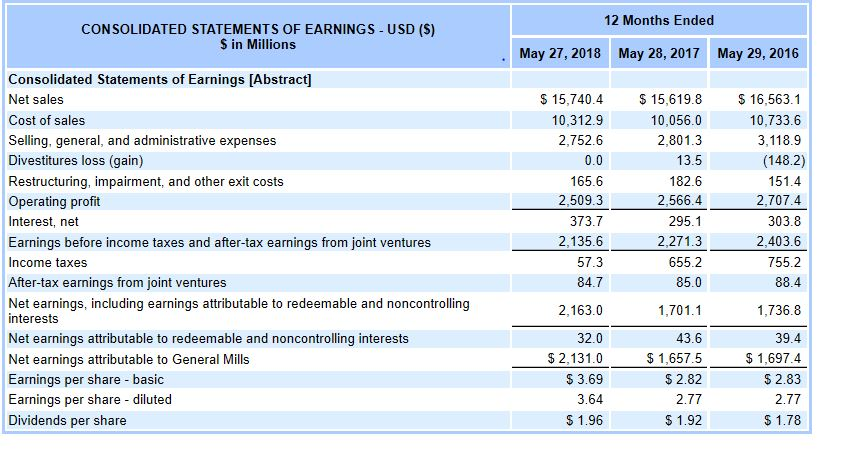
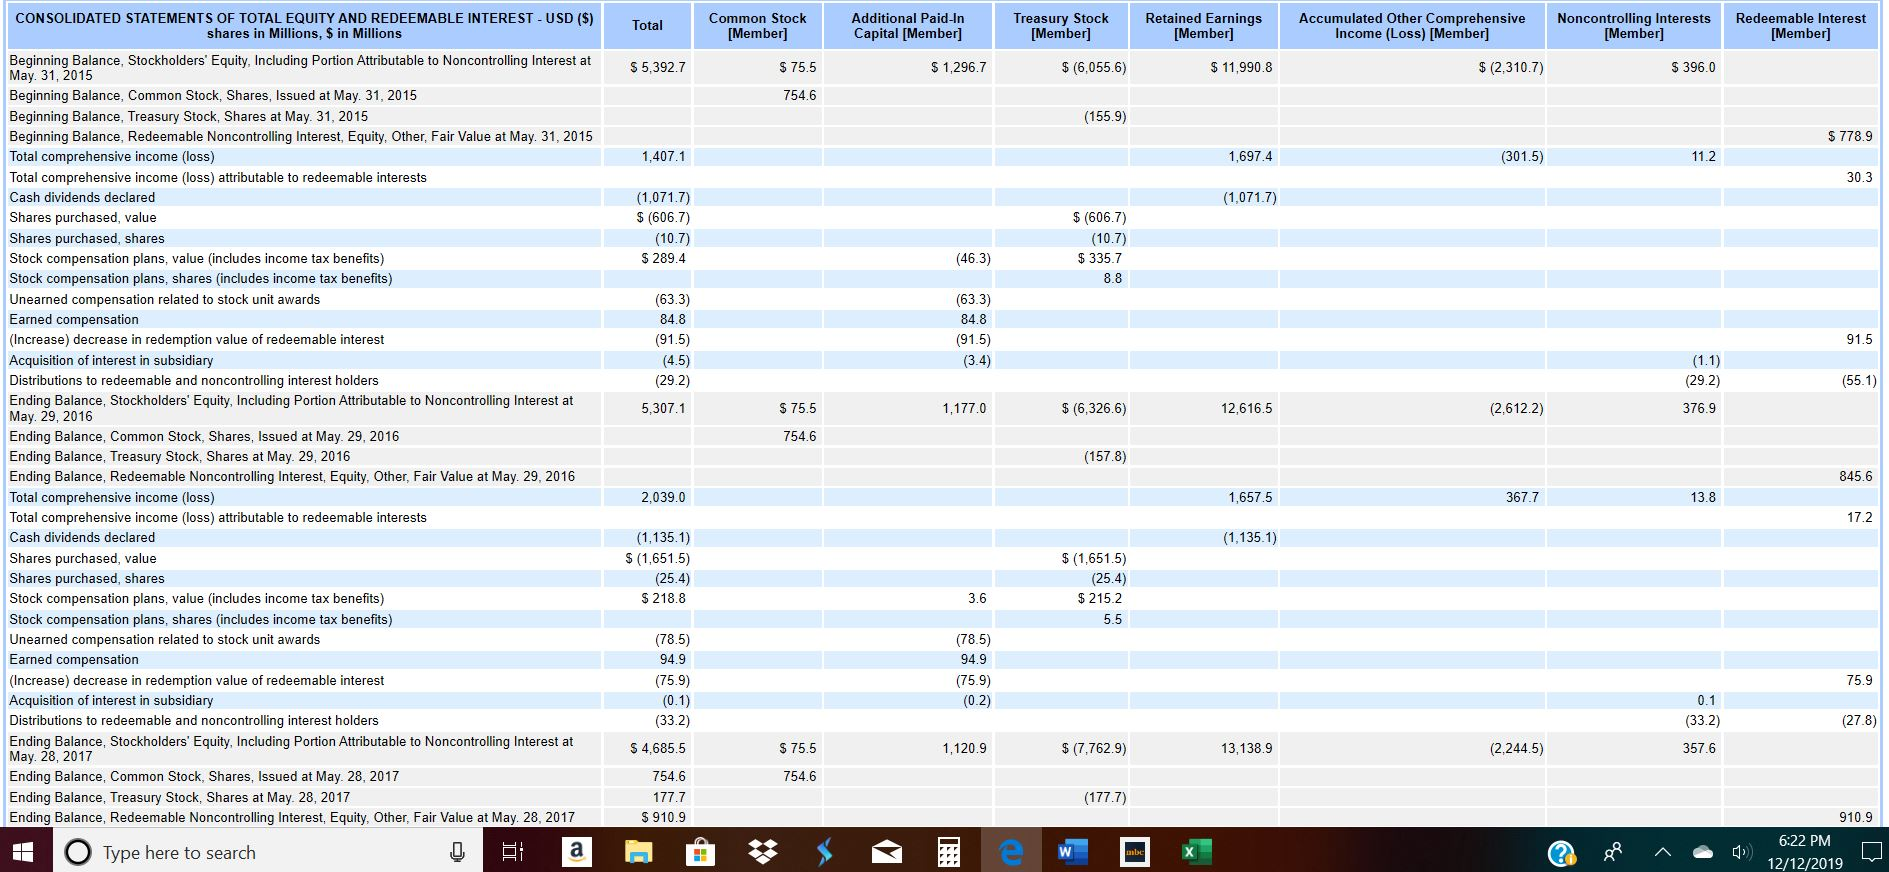
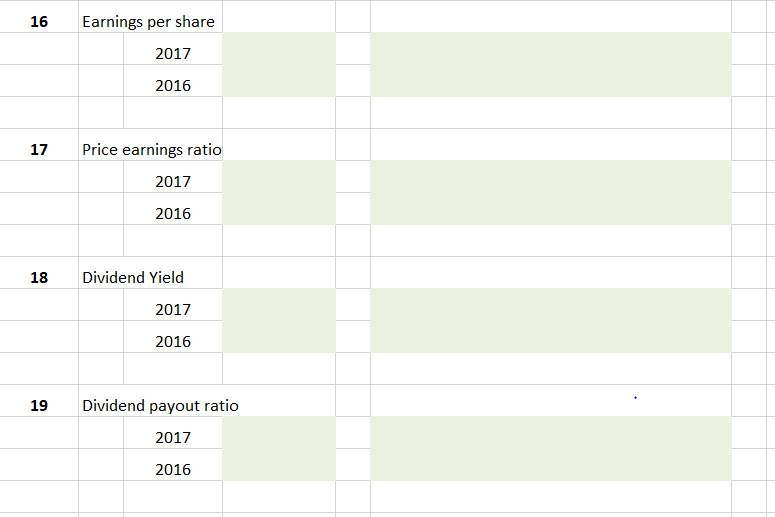
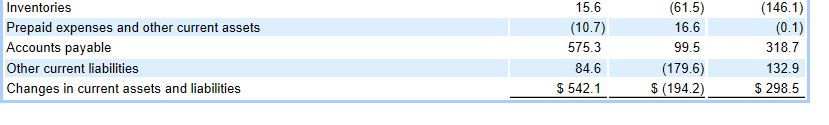
EYK14-5. Accounting Research Problem: General Mills, Inc. The fiscal year 2017 annual report of Gen- eral Mills, Inc. is available on this book's web site. Required Calculate (or identify) the following financial ratios for 2016 and 2017: 1. Gross profit percentage a. 2. Return on sales $21,832.0 million) $21,832.0 million) 3. Asset turnover (2015, total assets 4. Return on assets (2015, total assets 5. Return on common stockholders' equity (2015, total stockholders' equity: $4,996.7 million) 6. Current ratio 7. Quick ratio 8. Operating-cash-flow-to-current-liabilities ratio (2015, current liabilities million) 9. Accounts receivable turnover (2015, accounts receivable = $1,386.7 million) 10. Average collection period 11. Inventory turnover (2015, inventory = $1,540.9 million) 12. Days' sales in inventory 13. Debt-to-equity ratio $4,890.1 14. Times-interest-earned ratio 15. Operating-cash-flow-to-capital-expenditures ratio General Mills FYE 2017 e 1. Use the formulas contained in the Chapter to complete the "insert formula here" column of the template 2. For all references in the text to fiscal year 2017 -- use the information from the financial statements provided in the link for the year ended 05/27/18 3. For all references in the text to fiscal year 2016 - use the information from the financial statements provided in the link for the year ended 05/28/2017 4. For all calculations requiring averaging -- use the information from the text labeled fiscal year 2015 as the prior year balance 5. Round all percentages calculated to 1 decimal place, and all other answers to 2 decimal places I have attached a template below for this assignment however if you feel something is incorrect or missing be sure to ask it is the students responsibility to complete all requirements. For example Asset Turnover Ratio = Net Sales / Average Total Assets For 5/27/18 =15740.4/((30624+21812.6)/2) or .60 For 5/27/17 = 15619.8/((21812.6+21832)/2) or .73 GENERAL MILLS INC, 10-K filed on 6/29/2018 Annual Report Financial Statements Cover Notes to Financial Statements Accounting Policies No CONSOLIDATED BALANCE SHEETS- USD (S) S in Millions May 27, 2018 May 28, 2017 Current assets: $ 766.1 $ 399.0 Cash and cash equivalents 1,430.1 Receivables 1,684.2 Inventories 1,642.2 1,483.6 Prepaid expenses and other current assets 398.3 381.6 Total current assets 4,123.7 4,061.4 Land, buildings, and equipment 4,047.2 3,687.7 Goodwill 14,065.0 8,747.2 Other intangible assets 7,445.1 4,530.4 Other assets 943.0 785.9 30,624.0 21,812.6 Total assets Current liabilities: Accounts payable 2,119.8 2,746.2 604.7 Current portion of long-term debt Notes payable 1,600.1 1,549.8 1,234.1 Other current liabilities 1,445.8 1,372.2 7,341.9 5,330.8 Total current liabilities Long-term debt 12,668.7 7,642.9 1,719.4 Deferred income taxes 2,003.8 Other liabilities 1,341.0 1,523.1 Total liabilities 23,355.4 16.216.2 Redeemable interest 776.2 910.9 Stockholders' equity: 75.5 75.5 Common stock, 754.6 shares issued, $0.10 par value Additional paid-in capital Retained earnings 1,202.5 1,120.9 14,459.6 13,138.9 Common stock in treasury, at cost (7,167.5) (7,762.9) Accumulated other comprehensive loss (2,429.0) (2,244.5) Total stockholders' equity 6,141.1 4,327.9 Noncontrolling interests Total equity Total liabilities and equity 351.3 357.6 6,492.4 4,685.5 $ 30,624.0 $ 21,812.6 May 27, 2018 May 28, 2017 May 29, 2016 Cash Flows - Operating Activities Net earnings, including earnings attributable to redeemable and noncontrolling interests $ 2,163.0 $ 1,701.1 $ 1,736.8 Adjustments to reconcile net earnings to net cash provided by operating activities: 618.8 Depreciation and amortization 603.6 608.1 (85.0) After-tax earnings from joint ventures (84.7) (88.4) 75.6 Distributions of earnings from joint ventures 113.2 75.1 Stock-based compensation 77.0 95.7 89.8 120.6 Deferred income taxes (504.3) 183.9 (47.8) Pension and other postretirement benefit plan contributions (31.8) (45.4) Pension and other postretirement benefit plan costs 4.6 35.7 118.1 13.5 Divestitures loss (gain) 0.0 (148.2) Restructuring, impairment, and other exit costs 126.0 117.0 107.2 Changes in current assets and liabilities, excluding the effects of acquisitions and divestitures 542.1 298.5 (194.2) Other, net (182.9) (86.3) (105.6) Net cash provided by operating activities Cash Flows - Investing Activities 2,841.0 2,415.2 2,764.2 (684.4) Purchases of land, buildings, and equipment (622.7) (729.3) Acquisitions, net of cash acquired (8,035.8) 0.0 (84.0) 3.3 Investments in affiliates, net (17.3) 63.9 Proceeds from disposal of land, buildings, and equipment 1.4 4.2 4.4 0.0 17.5 Proceeds from divestitures 828.5 Exchangeable note 0.0 13.0 21.1 (0.5) Other, net (11.0) (11.2) Net cash provided (used) by investing activities (8,685.4) (646.9) 93.4 Cash Flows - Financing Activities Change in notes payable Issuance of long-term debt 327.5 962.4 (323.8) 542.5 6,550.0 1,072.1 (1,000.4) Payment of long-term debt (600.1) (1,000.0) Proceeds from common stock issued on exercised options 99.3 112.6 171.9 Proceeds from common stock issued 969.9 0.0 0.0 Purchases of common stock for treasury Dividends paid (601.6) (1,651.5) (606.7) (1,139.7) (1,135.1) (1,071.7) Distributions to noncontrolling and redeemable interest holders (51.8) (61.0) (84.3) Other, net (108.0) (46.9) (47.5) 5,445.5 (1,747.4) Net cash provided (used) by financing activities (2,420.0) Effect of exchange rate changes on cash and cash equivalents 31.8 (18.5) (8.1) Increase (decrease) in cash and cash equivalents (367.1) 2.4 429.5 766.1 Cash and cash equivalents - beginning of year 763.7 334.2 Cash and cash equivalents - end of year 766.1 399.0 763.7 Cash Flow from Changes in Current Assets and Liabilities, excluding effects of acquisitions and divestitures: Receivables (122.7) (69.2) (6.9) (61.5) Inventories 15.6 (146.1) 12 Months Ended CONSOLIDATED STATEMENTS OF EARNINGS - USD (S) S in Millions May 27, 2018 May 28, 2017 May 29, 2016 Consolidated Statements of Earnings [Abstract] $ 15,740.4 $ 15,619.8 $ 16,563.1 Net sales Cost of sales 10,312.9 10,056.0 10,733.6 Selling, general, and administrative expenses 2,752.6 2,801.3 3,118.9 Divestitures loss (gain) 0.0 13.5 (148.2) 182.6 Restructuring, impairment, and other exit costs 165.6 151.4 Operating profit 2,509.3 2,566.4 2,707.4 303.8 Interest, net 373.7 295.1 2,135.6 2,271.3 2,403.6 Earnings before income taxes and after-tax earnings from joint ventures 655.2 Income taxes 57.3 755.2 85.0 After-tax earnings from joint ventures 84.7 88.4 Net earnings, including earnings attributable to redeemable and noncontrolling interests 2,163.0 1,701.1 1,736.8 32.0 43.6 39.4 Net earnings attributable to redeemable and noncontrolling interests $ 2,131.0 $ 1,657.5 $ 2.82 $ 1,697.4 $ 2.83 Net earnings attributable to General Mills Earnings per share - basic Earnings per share - diluted Dividends per share $ 3.69 3.64 2.77 2.77 $ 1.92 $ 1.96 $ 1.78 Retained Earnings [Member] Common Stock [Member] CONSOLIDATED STATEMENTS OF TOTAL EQUITY AND REDEEMABLE INTEREST - USD ($) shares in Millions, $ in Millions Additional Paid-In Capital [Member] Treasury Stock [Member] Accumulated Other Comprehensive Income (Loss) [Member] Redeemable Interest [Member] Noncontrolling Interests [Member] Total Beginning Balance, Stockholders' Equity, Including Portion Attributable to Noncontrolling Interest at May. 31, 2015 $ 5,392.7 $ 1,296,7 $ (6,055.6) $ (2,310.7) $ 11,990.8 $ 396.0 $ 75.5 Beginning Balance, Common Stock, Shares, Issued at May. 31, 2015 754.6 Beginning Balance, Treasury Stock, Shares at May. 31, 2015 (155.9) $ 778.9 Beginning Balance, Redeemable Noncontrolling Interest, Equity, Other, Fair Value at May. 31, 2015 Total comprehensive income (loss) 1,407.1 1.697.4 (301.5) 11.2 30.3 Total comprehensive income (loss) attributable to redeemable interests Cash dividends declared (1,071.7) (1,071.7) $ (606.7) $ (606.7) Shares purchased, value Shares purchased, shares (10.7) (10.7) $ 335.7 $ 289.4 Stock compensation plans, value (includes income tax benefits) (46.3) Stock compensation plans, shares (includes income tax benefits) 8.8 Unearned compensation related to stock unit awards (63.3) (63.3) Earned compensation 84.8 84.8 (Increase) decrease in redemption value of redeemable interest (91.5) (91.5) 91.5 (1.1) Acquisition of interest in subsidiary (4.5) (3.4) Distributions to redeemable and noncontrolling interest holders (29.2) (29.2) (55.1) Ending Balance, Stockholders' Equity, Including Portion Attributable to Noncontrolling Interest at May. 29, 2016 $ 75.5 $ (6,326.6) 376.9 5,307.1 1,177.0 12,616.5 (2,612.2) Ending Balance, Common Stock, Shares, Issued at May. 29, 2016 754.6 (157.8) Ending Balance, Treasury Stock, Shares at May. 29, 2016 845.6 Ending Balance, Redeemable Noncontrolling Interest, Equity, Other, Fair Value at May. 29, 2016 Total comprehensive income (loss) 1,657.5 2,039.0 367.7 13.8 Total comprehensive income (loss) attributable to redeemable interests 17.2 (1,135.1) $ (1,651.5) Cash dividends declared (1,135.1) $ (1,651.5) Shares purchased, value Shares purchased, shares (25.4) $ 218.8 (25.4) $ 215.2 Stock compensation plans, value (includes income tax benefits) 3.6 Stock compensation plans, shares (includes income tax benefits) 5.5 Unearned compensation related to stock unit awards (78.5) (78.5) Earned compensation 94.9 94.9 (Increase) decrease in redemption value of redeemable interest (75.9) (75.9) 75.9 Acquisition of interest in subsidiary (0.1) (0.2) 0.1 Distributions to redeemable and noncontrolling interest holders (33.2) (33.2) (27.8) Ending Balance, Stockholders' Equity, Including Portion Attributable to Noncontrolling Interest at May. 28, 2017 $ (7,762.9) $ 4,685.5 $ 75.5 (2,244.5) 1,120.9 13,138.9 357.6 Ending Balance, Common Stock, Shares, Issued at May. 28, 2017 754.6 754.6 Ending Balance, Treasury Stock, Shares at May. 28, 2017 177.7 (177.7) Ending Balance, Redeemable Noncontrolling Interest, Equity, Other, Fair Value at May. 28 , 2017 $ 910.9 910.9 6:22 PM Type here to search 12/12/2019 Earnings per share 16 2017 2016 Price earnings ratio 17 2017 2016 Dividend Yield 18 2017 2016 Dividend payout ratio 19 2017 2016 (61.5) (146.1) Inventories 15.6 Prepaid expenses and other current assets Accounts payable (10.7) 16.6 (0.1) 575.3 99.5 318.7 132.9 Other current liabilities 84.6 (179.6) $ 542.1 $ (194.2) $ 298.5 Changes in current assets and liabilities