

Answered step by step
Verified Expert Solution
Question
1 Approved Answer
omework Submitted The figure below shows a consumer maximizing utility at two different prices (the left panel) and the consumer's demand for good X

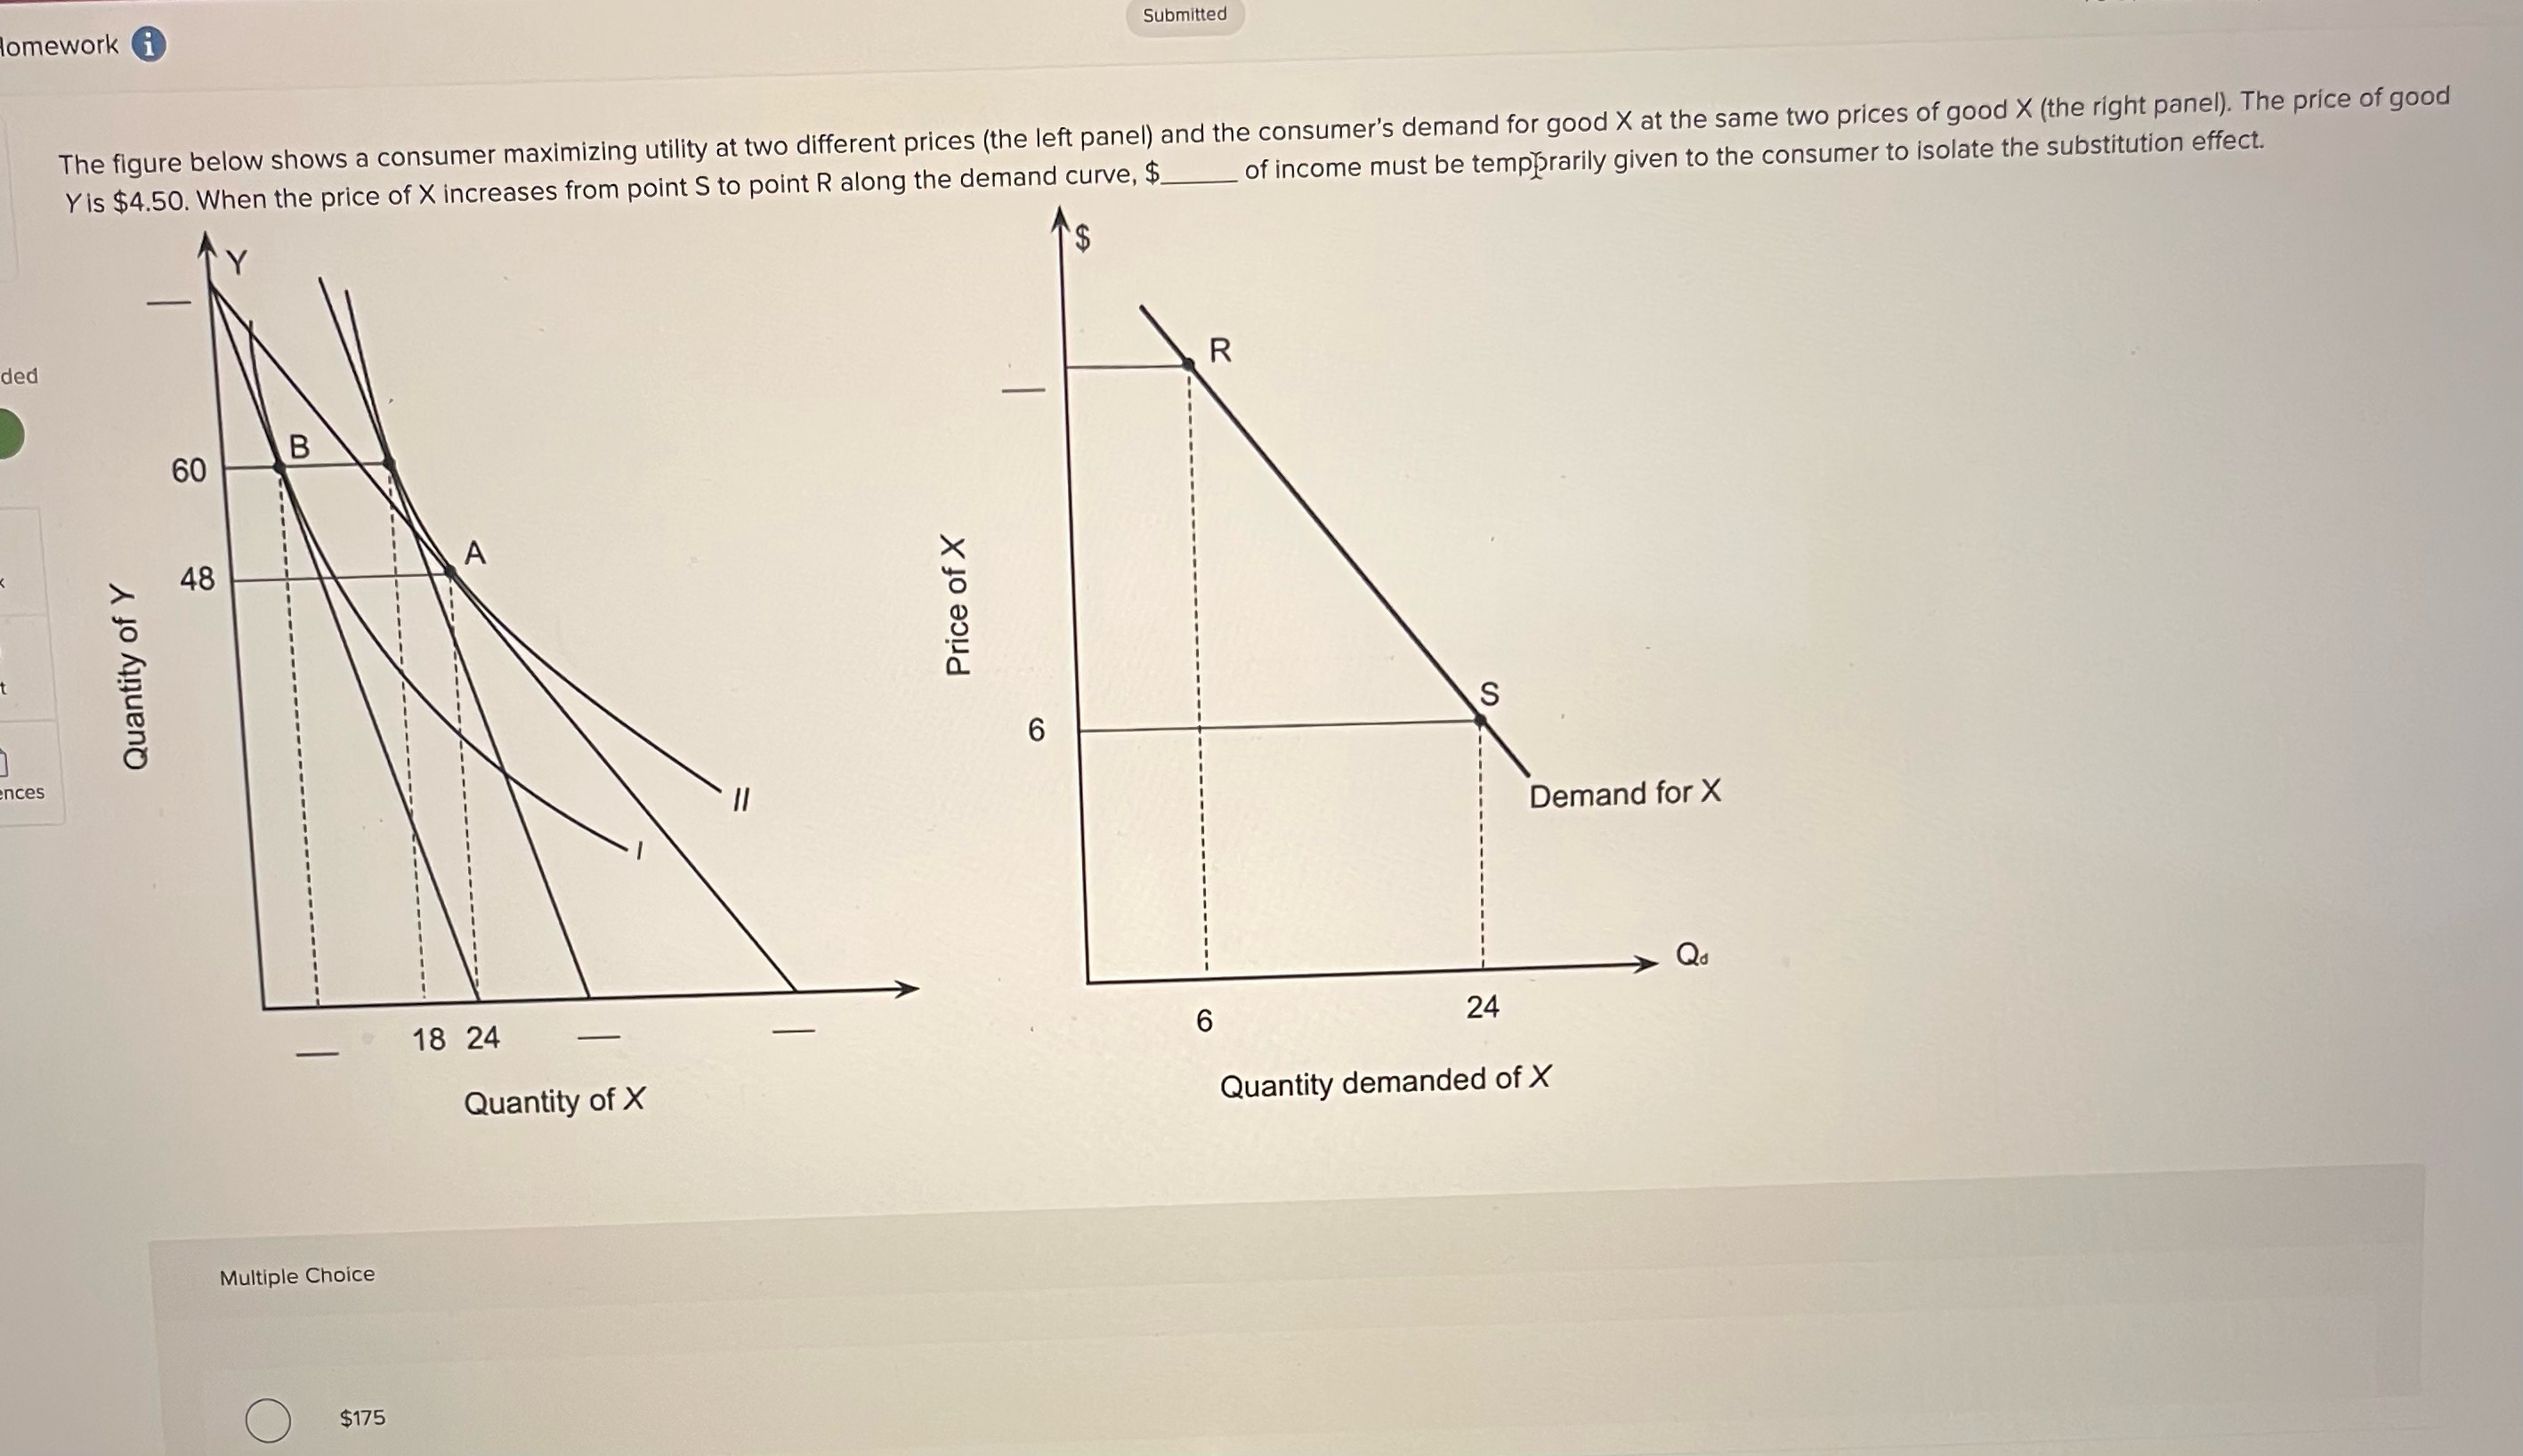
omework Submitted The figure below shows a consumer maximizing utility at two different prices (the left panel) and the consumer's demand for good X at the same two prices of good X (the right panel). The price of good Yis $4.50. When the price of X increases from point S to point R along the demand curve, $ ded 60 48 nces 11 18 24 Quantity of X Multiple Choice $175 of income must be tempprarily given to the consumer to isolate the substitution effect. Demand for X 24 Quantity demanded of X
Step by Step Solution
There are 3 Steps involved in it
Step: 1

Get Instant Access to Expert-Tailored Solutions
See step-by-step solutions with expert insights and AI powered tools for academic success
Step: 2

Step: 3
Ace Your Homework with AI
Get the answers you need in no time with our AI-driven, step-by-step assistance
Get Started
Macroeconomics Principles and Applications
Authors: Robert E. Hall, Marc Lieberman
6th edition
1111822352, 1111822354, 9781133708742 , 978-1111822354