

Answered step by step
Verified Expert Solution
Question
1 Approved Answer
9. Which of the following graphs below represents positive correlation?
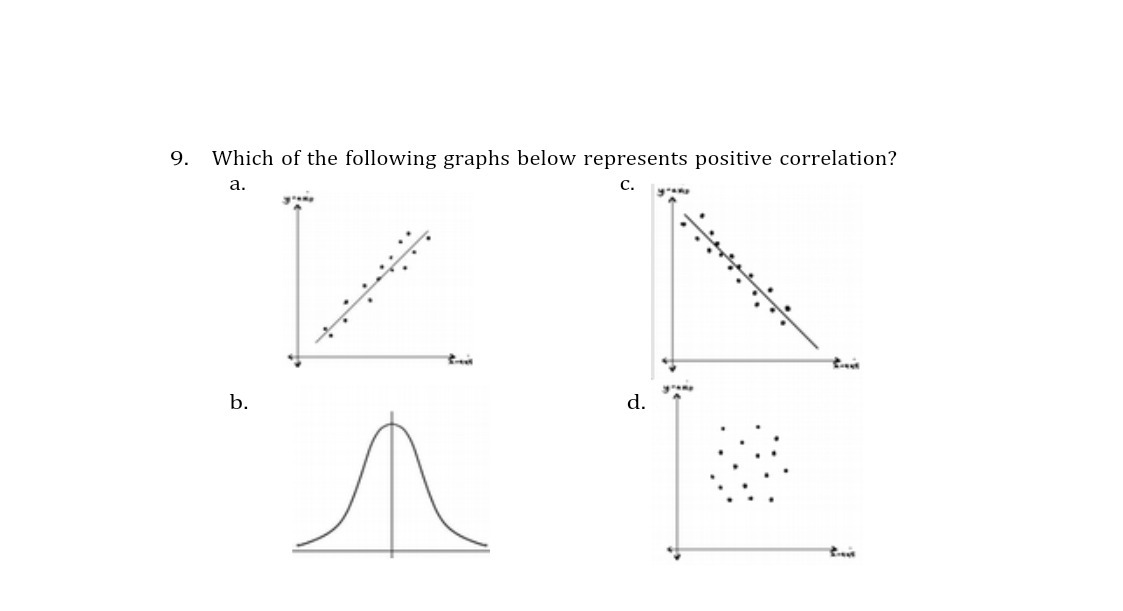

9. Which of the following graphs below represents positive correlation?
Step by Step Solution
There are 3 Steps involved in it
Step: 1

Get Instant Access to Expert-Tailored Solutions
See step-by-step solutions with expert insights and AI powered tools for academic success
Step: 2

Step: 3
Ace Your Homework with AI
Get the answers you need in no time with our AI-driven, step-by-step assistance
Get Started
Doing Data Analysis With SPSS Version 18.0
Authors: Dennis Coon, Robert H Carver, Jane Gradwohl Nash
5th Edition
1133171281, 9781133171287