

Answered step by step
Verified Expert Solution
Question
1 Approved Answer
Construct a scatterplot for the given data. x 0.33 0.92 0.36 0.29 y 0.5 0.49 0.08 0.27 _0.09 0.13 0.97 0.44 0.39 0.95 0.3
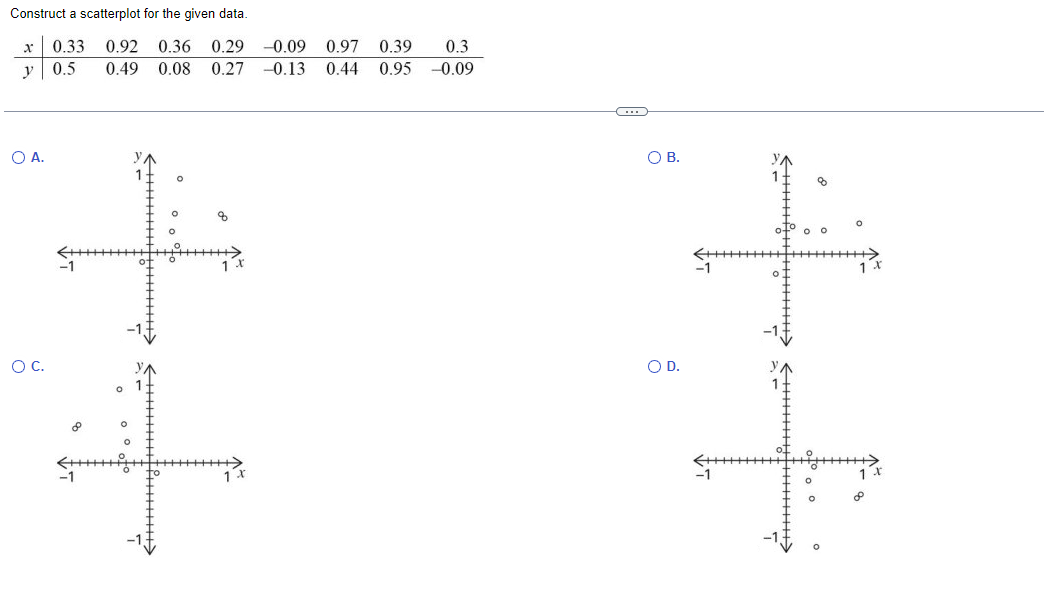

Construct a scatterplot for the given data. x 0.33 0.92 0.36 0.29 y 0.5 0.49 0.08 0.27 _0.09 0.13 0.97 0.44 0.39 0.95 0.3 0.09
Step by Step Solution
There are 3 Steps involved in it
Step: 1

Get Instant Access to Expert-Tailored Solutions
See step-by-step solutions with expert insights and AI powered tools for academic success
Step: 2

Step: 3
Ace Your Homework with AI
Get the answers you need in no time with our AI-driven, step-by-step assistance
Get Started
Stochastic Equations For Complex Systems Theoretical And Computational Topics
Authors: Stefan Heinz, Hakima Bessaih
1st Edition
3319182064, 9783319182063