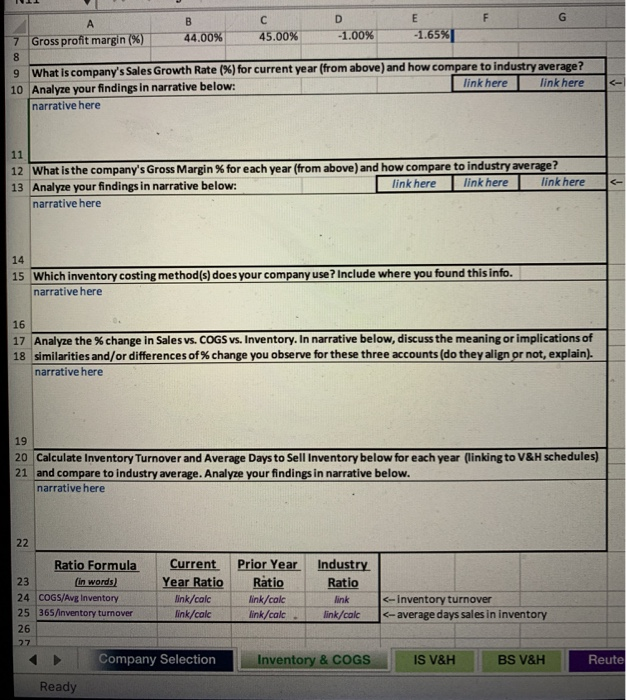
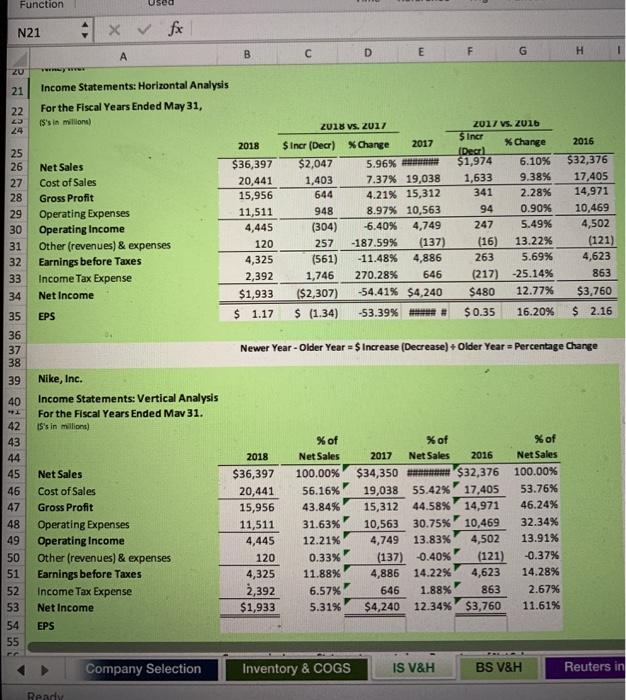
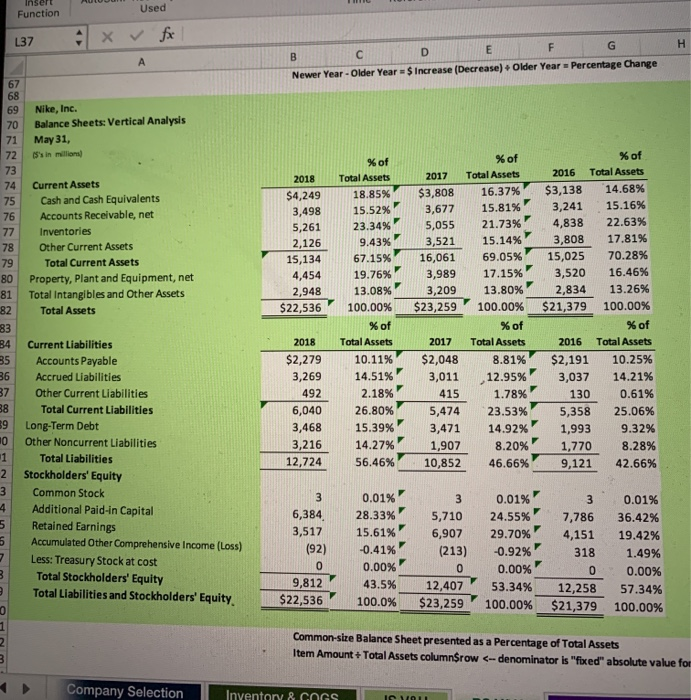
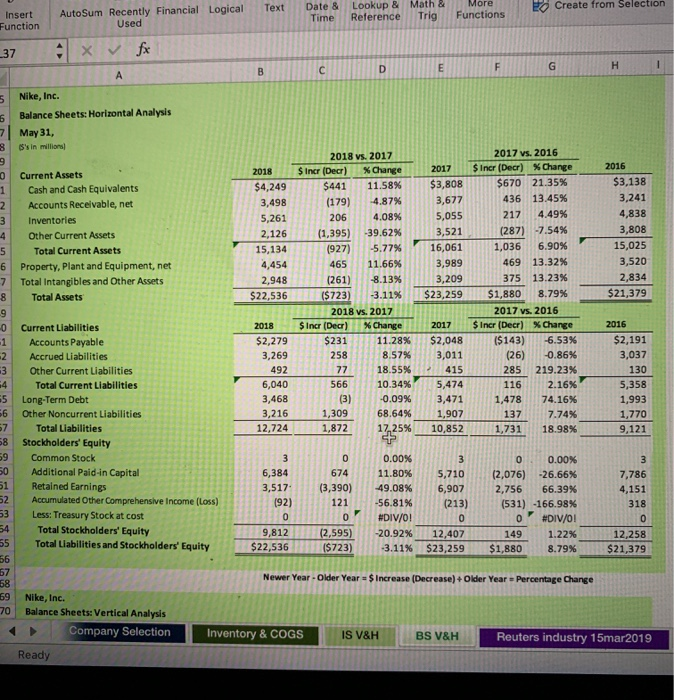
F G E D C B A -1.65% -1.00 % 45.00% 44.00% Gross profit margin (%) 7 9 What is company's Sales Growth Rate (%) for current year (from above) and how compare to industry average? 10 Analyze your findings in narrative below: narrative here link here link here 11 12 What is the company's Gross Margin % for each year (from above) and how compare to industry average? 13 Analyze your findings in narrative below: narrative here link here link here link here 14 15 Which inventory costing method (s) does your company use? Include where you found this info. narrative here 16 17 Analyze the % change in Sales vs. COGS vs. Inventory. In narrative below, discuss the meaning or implications of 18 similarities and/or differences of % change you observe for these three accounts (do they align or not, explain). narrative here 19 20 Calculate Inventory Turnover and Average Days to Sell Inventory below for each year (linking to V&H schedules) 21 and compare to industry average. Analyze your findings in narrative below. narrative here 22 Current Prior Year Industry Ratio Ratio Formula in words) 24 COGS/Avg Inventory Ratio Year Ratio 23 -inventory turnover average days sales in inventory link/calc ink/calc link 25 365/inventory turnover link/calc link/calc link/calc 26 27 Company Selection Reute Inventory & COGS IS V&H BS V&H Ready Function x f N21 H E F C A wwww mw 20 Income Statements: Horizontal Analysis 21 For the Fiscal Years Ended May 31, 22 IS's in millions) ZU17 vs. 2U16 ZU18 vs. ZU17 24 $Incr 2016 % Change $Incr (Decr) % Changer $2,047 2017 2018 (Decr) $1,974 25 26 $32,376 6.10% $36,397 5.96% # 7.37% 19,038 Net Sales Cost of Sales 9.38% 17,405 1,633 20,441 15,956 1,403 27 14,971 341 2.28 % 644 4.21% 15,312 28 Gross Profit 10,469 4,502 0.90% 8.97% 10,563 94 948 Operating Expenses Operating Income 11,511 4,445 29 5.49% 247 (304) -6.40 % 4,749 30 (121) 13.22% (137) 4,886 (16) 187.59 % 257 120 31 Other (revenues) & expenses 5.69% 4,623 263 (561) -11.48 % Earnings before Taxes 33 4,325 32 (217) 25.14 % 863 646 1,746 270.28% 2,392 Income Tax Expense $ 4,240 12.77% $3,760 -54.41 % $480 $1,933 ($2,307) Net Income 34 $ (1.34) 16.20 % $ 2.16 $ 1.17 -53.39% # # n # $0.35 35 EPS 36 $Increase (Decrease)+ Older Year Percentage Change Newer Year -Older Year 37 38 Nike, Inc. 39 Income Statements: Vertical Analysis 40 For the Fiscal Years Ended Mav 31. (S's in millions) 42 % of % of % of 43 Net Sales Net Sales Net Sales 2017 2016 2018 44 $34,350 un $32,376 100.00 % 100.00 % $36,397 45 Net Sales 53.76% 17,405 56.16% 19,038 55.42% 46 Cost of Sales 20,441 46.24 % 44.58 % 14,971 10,563 30.75% 10,469 13.83 % (137) 0.40 % 4,886 43.84% 15,312 47 Gross Profit 15,956 32.34% 48 Operating Expenses 11,511 31.63% 4,502 13.91 % Operating Income Other (revenues) & expenses Earnings before Taxes Income Tax Expense 4,749 49 12.21 % 4,445 (121) 4,623 -0.37% 50 0.33% 120 14.28 % 14.22% 51 11.88% 4,325 2,392 863 2.67% 52 6.57% 646 1.88% $3,760 11.61 % $4,240 $1,933 12.34% 53 Net Income 5.31% 54 EPS 55 Reuters in BS V&H IS V&H Company Selection Inventory & COGS Ready Insert Used Function fx L37 G F E D C A Percentage Change $ Increase (Decrease)+ Older Year Newer Year-Older Year 67 68 Nike, Inc. 69 Balance Sheets: Vertical Analysis 70 May 31, 71 72 CS's in millions) % of % of % of 73 Total Assets 2016 Total Assets 2017 Total Assets 2018 Current Assets 74 $3,138 14.68% 16.37 % $3,808 18.85% $4,249 Cash and Cash Equivalents 75 15.16 % 3,241 15.81% 3,677 15.52% 3,498 Accounts Receivable, net 76 22.63% 4,838 21.73% 23.34% 5,055 5,261 Inventories 77 17.81 % 3,808 15.14% 3,521 9.43% 2,126 78 Other Current Assets 70.28% 69.05% 15,025 16,061 15,134 67.15% 79 Total Current Assets 3,520 16.46% 3,989 17.15% 19.76% 4,454 80 Property, Plant and Equipment, net 13.80 % 13.26% 13.08 % 2,834 3,209 2,948 81 Total Intangibles and Other Assets 100.00 % $23,259 $21,379 100.00% $22,536 100.00% 82 Total Assets % of % of % of 83 B4 35 36 Total Assets Total Assets 2018 2017 Total Assets 2016 Current Liabilities $2,279 10.11 % $2,048 $2,191 8.81% 10.25% Accounts Payable Accrued Liabilities 3,269 14.51 % 3,011 12.95% 3,037 14.21% 7 Other Current Liabilities 492 2.18% 415 130 0.61 % 1.78% 8 Total Current Liabilities 6,040 26.80 % 23.53% 5,358 25.06% 5,474 9 Long-Term Debt 0 3,468 15.39% 3,471 14.92% 1,993 9.32% Other Noncurrent Liabilities 3,216 14.27% 1,907 8.20% 8.28% 1,770 1 Stockholders' Equity Total Liabilities 12,724 56.46% 10,852 46.66% 9,121 42.66% 2 3 Common Stock Additional Paid-in Capital 5 3 0.01% 0.01 % 0.01% 4 6,384 28.33% 5,710 24.55% 7,786 36.42% Retained Earnings Accumulated Other Comprehensive Income (Loss) 3,517 15.61 % 6,907 29.70% 4,151 19.42% (92) -0.41 % (213) -0.92% 318 1.49% Less: Treasury Stock at cost Total Stockholders' Equity Total Liabilities and Stockholders' Equity 0 0.00% 0.00% 0 0.00% 9,812 43.5% 12,407 $23,259 53.34% 12,258 57.34% $22,536 100.0 % 100.00 % $21,379 100.00% Common-size Balance Sheet presented as a Percentage of Total Assets Item Amount + Total Assets column$row