Farmers Groceries To You (FGTY) is a fast-growing company started by JMU alumni, which delivers fresh groceries collected in Virginia farms to families in

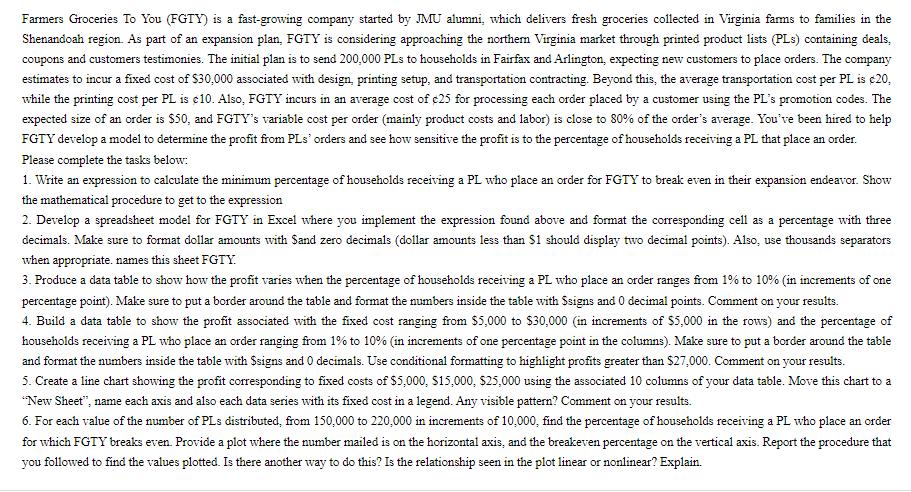
Farmers Groceries To You (FGTY) is a fast-growing company started by JMU alumni, which delivers fresh groceries collected in Virginia farms to families in the Shenandoah region. As part of an expansion plan, FGTY is considering approaching the northern Virginia market through printed product lists (PLs) containing deals, coupons s and customers testimonies. The initial plan is to send 200,000 PLs to households in Fairfax and Arlington, expecting new customers to place orders. The company estimates to incur a fixed cost of $30,000 associated with design, printing setup, and transportation contracting. Beyond this, the average transportation cost per PL is 20, while the printing cost per PL is c10. Also, FGTY incurs in an average cost of $25 for processing each order placed by a customer using the PL's promotion codes. The expected size of an order is $50, and FGTY's variable cost per order (mainly product costs and labor) is close to 80% of the order's average. You've been hired to help FGTY develop a model to determine the profit from PLs' orders and see how sensitive the profit is to the percentage of households receiving a PL that place an order. Please complete the tasks below: 1. Write an expression to calculate the minimum percentage of households receiving a PL who place an order for FGTY to break even in their expansion endeavor. Show the mathematical procedure to get to the expression 2. Develop a spreadsheet model for FGTY in Excel where you implement the expression found above and format the corresponding cell as a percentage with three decimals. Make sure to format dollar amounts with Sand zero decimals (dollar amounts less than $1 should display two decimal points). Also, use thousands separators when appropriate. names this sheet FGTY. 3. Produce a data table to show how the profit varies when the percentage of households receiving a PL who place an order ranges from 1% to 10% (in increments of one percentage point). Make sure to put a border around the table and format the numbers inside the table with Ssigns and 0 decimal points. Comment on your results. 4. Build a data table to show the profit associated with the fixed cost ranging from $5,000 to $30,000 (in increments of $5,000 in the rows) and the percentage of households receiving a PL who place an order ranging from 1% to 10% (in increments of one percentage point in the columns). Make sure to put a border around the table and format the numbers inside the table with Ssigns and 0 decimals. Use conditional formatting to highlight profits greater than $27,000. Comment on your results. 5. Create a line chart showing the profit corresponding to fixed costs of $5,000, $15,000, $25,000 using the associated 10 columns of your data table. Move this chart to a *New Sheet", name each axis and also each data series with its fixed cost in a legend. Any visible pattern? Comment on your results. 6. For each value of the number of PLs distributed, from 150,000 to 220,000 in increments of 10,000, find the percentage of households receiving a PL who place an order for which FGTY breaks even. Provide a plot where the number mailed is on the horizontal axis, and the breakeven percentage on the vertical axis. Report the procedure that you followed to find the values plotted. Is there another way to do this? Is the relationship seen in the plot linear or nonlinear? Explain.
Step by Step Solution
3.41 Rating (154 Votes )
There are 3 Steps involved in it
Step: 1

See step-by-step solutions with expert insights and AI powered tools for academic success
Step: 2

Step: 3

Ace Your Homework with AI
Get the answers you need in no time with our AI-driven, step-by-step assistance
Get Started


