

Answered step by step
Verified Expert Solution
Question
1 Approved Answer
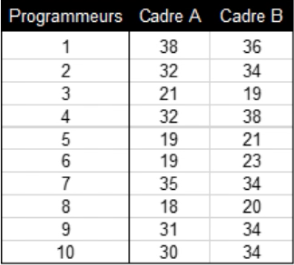
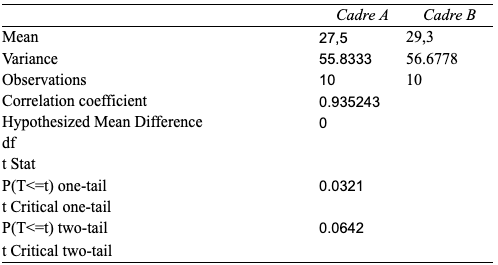
fCadre A Cadre B Mean 27,5 29,3 Variance 55.8333 56.6778 Observations 10 10 Correlation coefficient 0.935243 Hypothesized Mean Difference df t Stat P(T


Step by Step Solution
There are 3 Steps involved in it
Step: 1

Get Instant Access to Expert-Tailored Solutions
See step-by-step solutions with expert insights and AI powered tools for academic success
Step: 2

Step: 3
Ace Your Homework with AI
Get the answers you need in no time with our AI-driven, step-by-step assistance
Get Started
Mathematics In Middle And Secondary School A Problem Solving Approach
Authors: Alexander Karp, Nicholas Wasserman
1st Edition
1623968143, 9781623968144