

Question
Feel free to either give me the steps to do the following tasks in JMP or I can provide the dataset if there is a
Feel free to either give me the steps to do the following tasks in JMP or I can provide the dataset if there is a way.
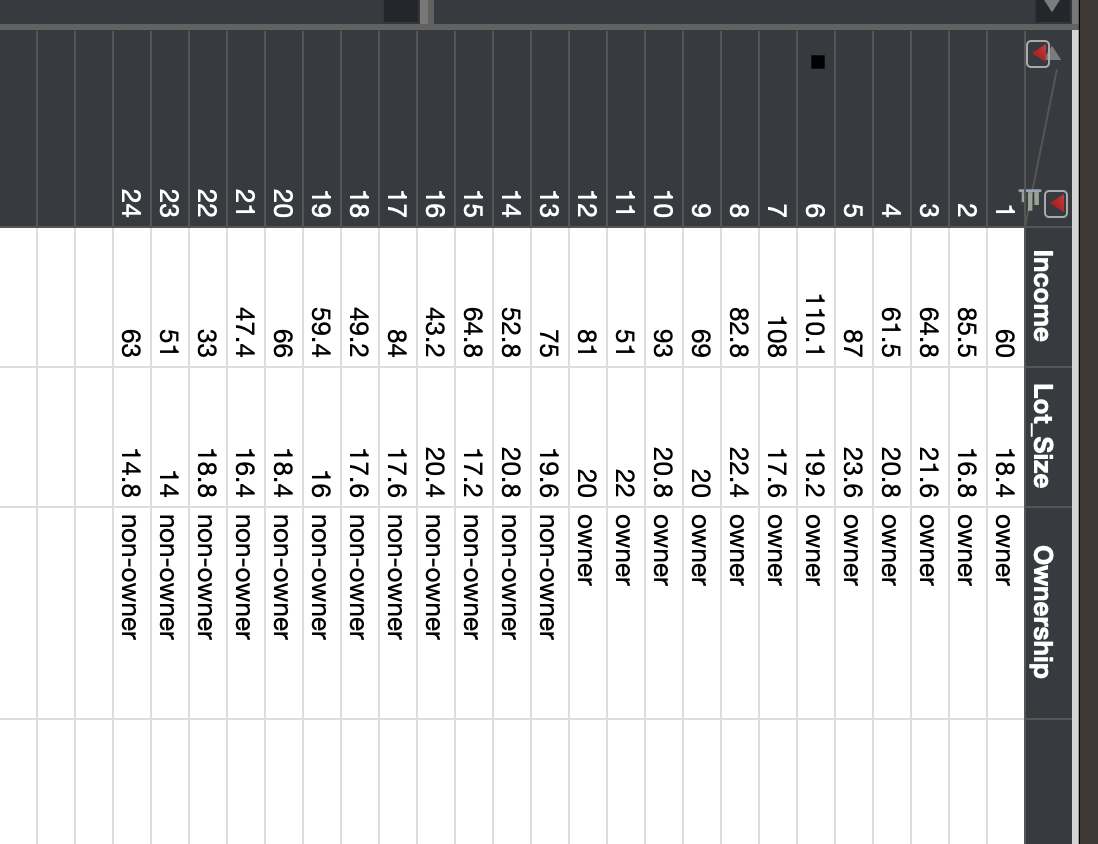
Using the RidingMowers.jmp data which contains information about who the best sales prospects are for an intensive sales campaign. The INCOME (in 1000s) and the LOT_SIZE (in 1000 ft2) for a random sample of 24 homes is listed along with whether those homes had a riding lawn mower. Don't use validation. Set Target = non-owner.
- What percentage of households in the study were owners of a riding mower? Hint: You use descriptive stats
- Color the observations that are owners purple. Create a scatterplot of Income vs. Lot size. Which class seems to have the higher income? Which class seems to have the larger lot size?
- Run a logistic regression predicting ownership with INCOME and LOT_SIZE. Save the Probability formula in the dataset. Create a confusion matrix. What is Error Rate?
- What are the odds that a household with $60,000 income and a lot size of 20,000 sq ft is a non-owner? (Note: Keep all your decimal places to get accuracy)
- Assuming a cutoff of .5, create a rule for classification of non-owner based on the odds. What is the classification for a household with $60,000 income and a lot size of 20,000 sq ft?
- What is the minimum income that a household with 16,000 sq ft lot size should have before it is classified as an owner?
Below is what's in the dataset. Just three columns with Income, Lot-Size, and Ownership.
Step by Step Solution
There are 3 Steps involved in it
Step: 1

Get Instant Access to Expert-Tailored Solutions
See step-by-step solutions with expert insights and AI powered tools for academic success
Step: 2

Step: 3
Ace Your Homework with AI
Get the answers you need in no time with our AI-driven, step-by-step assistance
Get Started
Trillions How A Band Of Wall Street Renegades Invented The Index Fund And Changed Finance Forever
Authors: Robin Wigglesworth
1st Edition
0593087682,0593087690