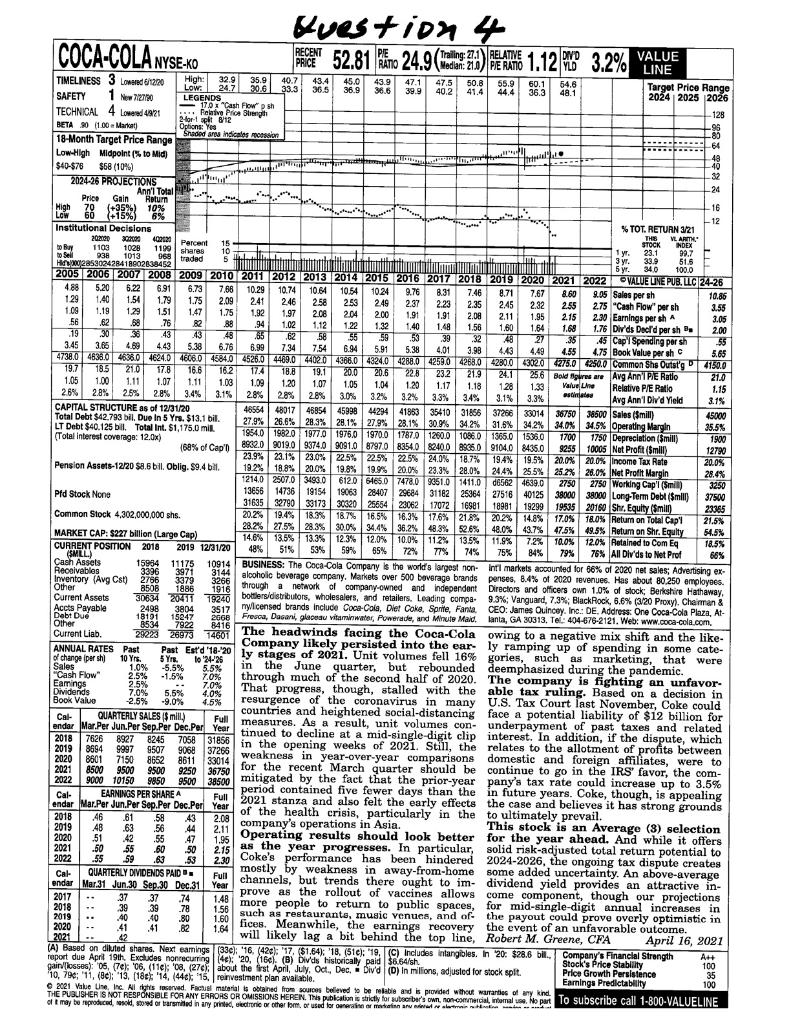
 Felicia OBrian is a recently hired analyst at Green Rock Investment. She believes that comparison with industry metrics provide more accurate answers for stocks than comparisons to the entire market. She is assigned to evaluate Coca Cola (KO) a beverage company. Based on the attached Value Line Sheet for KO, complete the following table and then complete the other table evaluating each ratio independently. For comparative calculation, the Industry Averages are used as a benchmark. First you have to decide whether the ratio indicates a BUY or SELL and then the justification. Assume that the instructor is aware of the meaning of each of the ratios. (10 Points)
| Ratio | KO | Industry |
| PE | | 19x |
| Relative PE | | 1 |
| Median PE | | |
| PEG | | 3.20 |
| Ratio | Circle Decision | Justification/Explanation |
| Relative PE | BUY SELL | |
| Median PE | BUY SELL | |
| PEG | BUY SELL | |
Guestion 4 COCA-COLA NYSE:KO re . THE 15 1190 sharee 968 traded 51.6 5 yr. RECENT PIE PRICE RATIO YLD LINE TIMELINESS 3 Lowed 6/12/20 High: 32.935.9 40.7 43.4 45.0 43.9 47.1 47.5 50.8 55.9 60.1 54.6 Low. 24.7 308 33.3 36.5 36.9 Target Price Range 1 2190 39.8 SAFETY 40.2 41.444.4 36.3 48.1 LEGENDS 2024 2025 2026 170 Cash Flowsh TECHNICAL 4 Lowered 448/21 Folivo Price Strength 128 2 forsk 8/12 BETA 90 (1.00. Marka) Options: Yos -95 Shaded an indicatos monsi 80 18-Month Target Price Range -64 Low-High Midpoint (% to Mid $40-$76 $68 (10%) 48 2024-26 PROJECTIONS -32 Ann'l Total -24 Price Gain Return .... High 70 (+35%) 109 10% 16 Low 60 (+15%) 6% - 12 Institutional Decisions % TOT. RETURN 3/21 20:2000 30000 402121 VL ARM Percent STOCK NDEX to Buy 1103 1028 to sell 10 1 yr. 23.1 938 1013 06 99.7 Hi, W28580042841AG02638452 5 totalitat de regio ALAMI DANA 3 yr. 33.9 340 100.0 2005 2006 2007 2008 2009 2010 2011 2012 2013 2014 2015 2016 2017 2018 2019 2020 2021 2022 VALUE UNE PUB. LLC 24-26 4.88 5.20 6.22 6.91 6.73 7.66 10.29 10.74 10.64 10.54 1024 9.76 8.31 7.46 8.71 7.67 8.60 9.05 Sales per sh 10.86 129 1.40 1.54 1.79 1.75 2.09 241 246 258 2.53 249 2.37 2.23 2.35 2.45 2.32 255 1.19 2.75 "Cash Flow" per sh 1.09 3.55 129 1.51 1.47 1.75 1,92 1.97 2.08 2.04 2.00 1.91 1.91 1.95 2.08 2.11 2.15 2.30 Earnings per sh A 56 3.05 .62 .68 76 82 .88 94 1.02 1.12 122 1.32 1.40 1.48 1.56 1.60 1.64 1.68 1.76 Divds Decld per sh 2.00 .19 30 38 43 43 65 .62 .58 55 .59 53 39 32 48 27 .35 45 Cap Spending per sh 55 3.45 3.65 4.69 4.43 5.38 6.76 6.99 7.34 7.54 6.94 5.91 5.38 4.01 3.98 4.43 4.49 4.55 4.75 Book Value per sh 5.65 473804838.0 4638.0 1624.0 4606.04684204526.0 4469.0 4402043860 432404288.0 425802268.0 4280.0430204275.0 4250.0 Common Shs Outst'g 4150.0 19.7 185210 17.8 16.6 162 174 18.8 19.1 200 20.6 228 23.2 1.05 1.00 1.11 1.07 21.9 21.1 256 Bold ware Avg Ann'I PE Ratio 21.0 1.11 1.03 1.09 1.20 1.07 1.05 1.04 1.20 1.17 1.18 128 1.33 Value Line Relative P/E Ratio 28% 2.8% 25% 28% 1.15 3.4% 3.1% 28% 28% 28% 3.0% 3.2% 3.2% 33% 3.4% 3.1% 3.3% estina Avg Ann'l Divd Yield 3.1% CAPITAL STRUCTURE as of 12/31/20 46554 4801748854 45998 4429441853 35410 318563726633014 36750 38500 Sales (mill) Total Debt $42.793 bil. Duo In 5 Yrs. $13.1 bil. 45000 27.9% 26.6% 28.3% 29,1% 27.9% 23.1% 30.9% 34.2% 31.6% 34.2% 34.0% 34.5% Operating Margin LT Debt $40.125 bil. Total Int. $1,175.0 mil. 25.5% (Total Interest coverage: 12.0x) 1954.0 1982,0 1977.0 1976.0 1970.0 1787,0 1200.0 1086.0 1365.0 1536.0 1700 1750 Depreciation (Smill) 1900 168% of Cap' 8902.090190 93740 9091.0 9797.0 8354.0 82400 2905.0 9104.0 8435.0 8255 10005 Not Profit ($mill) 12790 23.9% 23.1% 23.0% 22.5% 22.5% 22.5% 24.0% 187% 194% 19.5% 20.0% 20.0% Income Tax Rate Pension Assets-12/20 $8.6 bil. Oblig. $9.4 bill 20.0% 19.8% 19.9% 20.0% 23.3% 28.0% 24.4% 25.5% 25.2% 26.0% Net Profit Margin 12140 2507.0 3490.0 6120 6465.0 7478.0 9051.0 1411.006562 1639.0 2750 28.4% 2750 Working Cap' (Smil) 3250 13656 Pld Stock None 14736 1915419063 28407 2968431182 25364 27516 40125 38000 39000 Long-Term Debt ($mill) 37500 31695 32790 33173 30320 2566423062 1707216901 18981 19299 19535 20150 Shr. Equity (Smilit) 23365 Common Stock 4.302,000,000 shs. 20.76 1945 18.3% 187% 16.5% 16.3% 17.6% 218% 202% 14.8% 17.0% 18.0% Return on Total Cap'l 21.5% 28.2% 27.5% 28.3% 30.0% 34.4% 36.2% 48.3% 52,6% MARKET CAP: 5227 billion (Large Cap) 48.0% 43.7% 47.5% 49.5% Retum on Shr. Equity 14.6% 13.5% 13.3% 12.3% 12.0% 100% 112% 13.5% 11.5% 7.2% 54.5% 7.2% 100% 12.0% Retained to Com Eq CURRENT POSITION 2018 2019 12/31/20 18.55 48% 51% 53% 59% 65% (SMLL) 72% 77% 74% 75% 84% 79% 76% All Div'ds to Net Prof 66% Cash Assets 15954 11175 10914 BUSINESS: The Coca-Cola Company is the world's largest non- intl markets accounted for 66% of 2020 net sales; Advertising ex- Recalvables 3396 3971 Inventory (Avg Cst) 2756 3379 3144 alcoholic beverage company. Markets over 500 beverage brands penses, 8.4% of 2020 revenues. Has about 80.250 employees. Other 8508 1866 1918 through a network of company-owned and independent Directors and officers own 1.0% of stock: Berkshire Hathaway Current Assets 30634 2411 19240 bottlers/distributors, wholesalers, and retailers. Leading compa. 9.3%: Vanguard, 7,3% Black Rock, 6.6% (3/20 Proxy). Chemman & Accts Payable 2498 3804 3517 nylcensed brands include Coca-Cola, Diet Coke. Sonte, Fanta CEO: James Ouinosy. Inc: DE. Address: One Coca-Cola Plaza, At- Debt Due 18191 15247 2668 Fresca, Dasani, glaceau vitamin water, Powerade and Minute Maid lanta, GA 30313, Tel.: 404-676-2121. Web: www.coca-cola.com Other 85347922 8416 Current Liab. 29223 28073 14601 The headwinds facing the Coca-Cola owing to a negative mix shift and the like- ANNUAL RATES Past Past Estd 18-20 ly stages of 2021. Unit volumes fell 16% gories, such as marketing, that were Company likely persisted into the early ramping up of spending in some cate- of change per shi 10 Yrs. 5 Yrs. 24-26 Sales 1.0% -5.5% 5.5% in the June quarter, but rebounded deemphasized during the pandemic. "Cash Flow" 2.5% -1.5% 7.0% through much of the second half of 2020. The company is fighting an unfavor. Earings 2.5% 7.0% Dividends That progress, though, stalled with the able tax ruling. Based on a decision in 7.0% 5,5% 4.0% Book Value 2.5% -9.0% 4.5% resurgence of the coronavirus in many U.S. Tax Court last November, Coke could Cal QUARTERLY SALES$ mill.) countries and heightened social-distancing face a potential liability of $12 billion for Full endar Mar.Per Jun.Per Sep.Per Dec.Per Year measures. As a result, unit volumes con- underpayment of past taxes and related 2018 7626 8927 8245 7058 31856 tinued to decline at a mid-single-digit clip interest. In addition, if the dispute, which 8245 7058 31856 in the opening weeks of 2021. Still, the relates to the allotment of profits between 2019 8694 9997 2020 86017150 8652 8611 33014 for the recent March quarter should be continue to go in the IRS favor, the com- weakness in year-over-year comparisons domestic and foreign affiliates, were to 2021 2022 9000 101509860 9500 38500 mitigated by the fact that the prior-year pany's tax rate could increase up to 3.5% Cal- EARNINGS PER SHARE A period contained five fewer days than the in future years. Coke, though, is appealing endar Mar.Per Jun.Per Sep.Per Dec.Per Year of the health crisis, particularly in the to ultimately prevail. Full 2021 stanza and also felt the early effects the case and believes it has strong grounds 2018 .46 .81 .58 2019 .48 .63 .56 44 3 company's operations in Asia. 2.11 This stock is an Average (8) selection 2020 .51 .42 .55 Operating results should look better for the year ahead. And while it offers 1.95 .47 2021 .50 55 .60 .50 215 as the year progresses. In particular, solid risk-adjusted total return potential to 2022 .55 59 .63 -53 2.30 Coke's performance has been hindered 2024-2026, the ongoing tax dispute creates Cal- QUARTERLY DIVIDENDS PAID mostly by weakness in away-from-home some added uncertainty. An above-average endar Mar 31 Jun 30 Sep.30 Dec. 31 Full channels, but trends there ought to im- dividend yield provides an attractive in- prove as the rollout of vaccines allows come component, though our projections 2017 37 37 .74 1.48 2018 39 39 .78 more people to return to public spaces, for mid-single-digit annual increases in 1.56 such as restaurants, music venues, and of the payout could prove overly optimistic in 2019 .40 .40 .80 1.60 2020 .. .41 41 .82 1.64 fices. Meanwhile, the earnings recovery the event of an unfavorable outcome. 42 will likely lag a bit behind the top line, Robert M. Greene, CFA April 16, 2021 (A) Based on diluted shares. Next samnings (336): 16. (426): 17. $1.64) '18. (510): "19, C) Includes intangibles. In 20: $28.6 bil. Company's Financial Strength report due April 19th Excludes nonrecurringe 20, 166)() blvds historically paid $6.64/sh A++ gainossos) 06, (Tel: 06, 11e 08, 276:about the first April July, Oct., Dec, Div'd (D) In milions, adjusted for stock splt. Stock's Price Stability 100 10,796; 11, (80): 13, (186): '14, (44tk 15. rinvestment plan available. Price Growth Persistence 35 2021 Value Une, Inc. All this served. For material obtained from sources bolleved to be reliable and is provided without wutarties of my kind. Earnings Predictability 100 THE PUBLISHER IS NOT RESPONSIBLE FOR ANY ERRORS OR OMISSIONS HEREN Trapublication is strictly for autocrbara cwn, non commercial, amal sa ho part to subscribe call 1-800-VALUELINE of t may be reproduced, sod, od or based in any printed, electronic v other form of used for generator mainan ini 2021.. Guestion 4 COCA-COLA NYSE:KO re . THE 15 1190 sharee 968 traded 51.6 5 yr. RECENT PIE PRICE RATIO YLD LINE TIMELINESS 3 Lowed 6/12/20 High: 32.935.9 40.7 43.4 45.0 43.9 47.1 47.5 50.8 55.9 60.1 54.6 Low. 24.7 308 33.3 36.5 36.9 Target Price Range 1 2190 39.8 SAFETY 40.2 41.444.4 36.3 48.1 LEGENDS 2024 2025 2026 170 Cash Flowsh TECHNICAL 4 Lowered 448/21 Folivo Price Strength 128 2 forsk 8/12 BETA 90 (1.00. Marka) Options: Yos -95 Shaded an indicatos monsi 80 18-Month Target Price Range -64 Low-High Midpoint (% to Mid $40-$76 $68 (10%) 48 2024-26 PROJECTIONS -32 Ann'l Total -24 Price Gain Return .... High 70 (+35%) 109 10% 16 Low 60 (+15%) 6% - 12 Institutional Decisions % TOT. RETURN 3/21 20:2000 30000 402121 VL ARM Percent STOCK NDEX to Buy 1103 1028 to sell 10 1 yr. 23.1 938 1013 06 99.7 Hi, W28580042841AG02638452 5 totalitat de regio ALAMI DANA 3 yr. 33.9 340 100.0 2005 2006 2007 2008 2009 2010 2011 2012 2013 2014 2015 2016 2017 2018 2019 2020 2021 2022 VALUE UNE PUB. LLC 24-26 4.88 5.20 6.22 6.91 6.73 7.66 10.29 10.74 10.64 10.54 1024 9.76 8.31 7.46 8.71 7.67 8.60 9.05 Sales per sh 10.86 129 1.40 1.54 1.79 1.75 2.09 241 246 258 2.53 249 2.37 2.23 2.35 2.45 2.32 255 1.19 2.75 "Cash Flow" per sh 1.09 3.55 129 1.51 1.47 1.75 1,92 1.97 2.08 2.04 2.00 1.91 1.91 1.95 2.08 2.11 2.15 2.30 Earnings per sh A 56 3.05 .62 .68 76 82 .88 94 1.02 1.12 122 1.32 1.40 1.48 1.56 1.60 1.64 1.68 1.76 Divds Decld per sh 2.00 .19 30 38 43 43 65 .62 .58 55 .59 53 39 32 48 27 .35 45 Cap Spending per sh 55 3.45 3.65 4.69 4.43 5.38 6.76 6.99 7.34 7.54 6.94 5.91 5.38 4.01 3.98 4.43 4.49 4.55 4.75 Book Value per sh 5.65 473804838.0 4638.0 1624.0 4606.04684204526.0 4469.0 4402043860 432404288.0 425802268.0 4280.0430204275.0 4250.0 Common Shs Outst'g 4150.0 19.7 185210 17.8 16.6 162 174 18.8 19.1 200 20.6 228 23.2 1.05 1.00 1.11 1.07 21.9 21.1 256 Bold ware Avg Ann'I PE Ratio 21.0 1.11 1.03 1.09 1.20 1.07 1.05 1.04 1.20 1.17 1.18 128 1.33 Value Line Relative P/E Ratio 28% 2.8% 25% 28% 1.15 3.4% 3.1% 28% 28% 28% 3.0% 3.2% 3.2% 33% 3.4% 3.1% 3.3% estina Avg Ann'l Divd Yield 3.1% CAPITAL STRUCTURE as of 12/31/20 46554 4801748854 45998 4429441853 35410 318563726633014 36750 38500 Sales (mill) Total Debt $42.793 bil. Duo In 5 Yrs. $13.1 bil. 45000 27.9% 26.6% 28.3% 29,1% 27.9% 23.1% 30.9% 34.2% 31.6% 34.2% 34.0% 34.5% Operating Margin LT Debt $40.125 bil. Total Int. $1,175.0 mil. 25.5% (Total Interest coverage: 12.0x) 1954.0 1982,0 1977.0 1976.0 1970.0 1787,0 1200.0 1086.0 1365.0 1536.0 1700 1750 Depreciation (Smill) 1900 168% of Cap' 8902.090190 93740 9091.0 9797.0 8354.0 82400 2905.0 9104.0 8435.0 8255 10005 Not Profit ($mill) 12790 23.9% 23.1% 23.0% 22.5% 22.5% 22.5% 24.0% 187% 194% 19.5% 20.0% 20.0% Income Tax Rate Pension Assets-12/20 $8.6 bil. Oblig. $9.4 bill 20.0% 19.8% 19.9% 20.0% 23.3% 28.0% 24.4% 25.5% 25.2% 26.0% Net Profit Margin 12140 2507.0 3490.0 6120 6465.0 7478.0 9051.0 1411.006562 1639.0 2750 28.4% 2750 Working Cap' (Smil) 3250 13656 Pld Stock None 14736 1915419063 28407 2968431182 25364 27516 40125 38000 39000 Long-Term Debt ($mill) 37500 31695 32790 33173 30320 2566423062 1707216901 18981 19299 19535 20150 Shr. Equity (Smilit) 23365 Common Stock 4.302,000,000 shs. 20.76 1945 18.3% 187% 16.5% 16.3% 17.6% 218% 202% 14.8% 17.0% 18.0% Return on Total Cap'l 21.5% 28.2% 27.5% 28.3% 30.0% 34.4% 36.2% 48.3% 52,6% MARKET CAP: 5227 billion (Large Cap) 48.0% 43.7% 47.5% 49.5% Retum on Shr. Equity 14.6% 13.5% 13.3% 12.3% 12.0% 100% 112% 13.5% 11.5% 7.2% 54.5% 7.2% 100% 12.0% Retained to Com Eq CURRENT POSITION 2018 2019 12/31/20 18.55 48% 51% 53% 59% 65% (SMLL) 72% 77% 74% 75% 84% 79% 76% All Div'ds to Net Prof 66% Cash Assets 15954 11175 10914 BUSINESS: The Coca-Cola Company is the world's largest non- intl markets accounted for 66% of 2020 net sales; Advertising ex- Recalvables 3396 3971 Inventory (Avg Cst) 2756 3379 3144 alcoholic beverage company. Markets over 500 beverage brands penses, 8.4% of 2020 revenues. Has about 80.250 employees. Other 8508 1866 1918 through a network of company-owned and independent Directors and officers own 1.0% of stock: Berkshire Hathaway Current Assets 30634 2411 19240 bottlers/distributors, wholesalers, and retailers. Leading compa. 9.3%: Vanguard, 7,3% Black Rock, 6.6% (3/20 Proxy). Chemman & Accts Payable 2498 3804 3517 nylcensed brands include Coca-Cola, Diet Coke. Sonte, Fanta CEO: James Ouinosy. Inc: DE. Address: One Coca-Cola Plaza, At- Debt Due 18191 15247 2668 Fresca, Dasani, glaceau vitamin water, Powerade and Minute Maid lanta, GA 30313, Tel.: 404-676-2121. Web: www.coca-cola.com Other 85347922 8416 Current Liab. 29223 28073 14601 The headwinds facing the Coca-Cola owing to a negative mix shift and the like- ANNUAL RATES Past Past Estd 18-20 ly stages of 2021. Unit volumes fell 16% gories, such as marketing, that were Company likely persisted into the early ramping up of spending in some cate- of change per shi 10 Yrs. 5 Yrs. 24-26 Sales 1.0% -5.5% 5.5% in the June quarter, but rebounded deemphasized during the pandemic. "Cash Flow" 2.5% -1.5% 7.0% through much of the second half of 2020. The company is fighting an unfavor. Earings 2.5% 7.0% Dividends That progress, though, stalled with the able tax ruling. Based on a decision in 7.0% 5,5% 4.0% Book Value 2.5% -9.0% 4.5% resurgence of the coronavirus in many U.S. Tax Court last November, Coke could Cal QUARTERLY SALES$ mill.) countries and heightened social-distancing face a potential liability of $12 billion for Full endar Mar.Per Jun.Per Sep.Per Dec.Per Year measures. As a result, unit volumes con- underpayment of past taxes and related 2018 7626 8927 8245 7058 31856 tinued to decline at a mid-single-digit clip interest. In addition, if the dispute, which 8245 7058 31856 in the opening weeks of 2021. Still, the relates to the allotment of profits between 2019 8694 9997 2020 86017150 8652 8611 33014 for the recent March quarter should be continue to go in the IRS favor, the com- weakness in year-over-year comparisons domestic and foreign affiliates, were to 2021 2022 9000 101509860 9500 38500 mitigated by the fact that the prior-year pany's tax rate could increase up to 3.5% Cal- EARNINGS PER SHARE A period contained five fewer days than the in future years. Coke, though, is appealing endar Mar.Per Jun.Per Sep.Per Dec.Per Year of the health crisis, particularly in the to ultimately prevail. Full 2021 stanza and also felt the early effects the case and believes it has strong grounds 2018 .46 .81 .58 2019 .48 .63 .56 44 3 company's operations in Asia. 2.11 This stock is an Average (8) selection 2020 .51 .42 .55 Operating results should look better for the year ahead. And while it offers 1.95 .47 2021 .50 55 .60 .50 215 as the year progresses. In particular, solid risk-adjusted total return potential to 2022 .55 59 .63 -53 2.30 Coke's performance has been hindered 2024-2026, the ongoing tax dispute creates Cal- QUARTERLY DIVIDENDS PAID mostly by weakness in away-from-home some added uncertainty. An above-average endar Mar 31 Jun 30 Sep.30 Dec. 31 Full channels, but trends there ought to im- dividend yield provides an attractive in- prove as the rollout of vaccines allows come component, though our projections 2017 37 37 .74 1.48 2018 39 39 .78 more people to return to public spaces, for mid-single-digit annual increases in 1.56 such as restaurants, music venues, and of the payout could prove overly optimistic in 2019 .40 .40 .80 1.60 2020 .. .41 41 .82 1.64 fices. Meanwhile, the earnings recovery the event of an unfavorable outcome. 42 will likely lag a bit behind the top line, Robert M. Greene, CFA April 16, 2021 (A) Based on diluted shares. Next samnings (336): 16. (426): 17. $1.64) '18. (510): "19, C) Includes intangibles. In 20: $28.6 bil. Company's Financial Strength report due April 19th Excludes nonrecurringe 20, 166)() blvds historically paid $6.64/sh A++ gainossos) 06, (Tel: 06, 11e 08, 276:about the first April July, Oct., Dec, Div'd (D) In milions, adjusted for stock splt. Stock's Price Stability 100 10,796; 11, (80): 13, (186): '14, (44tk 15. rinvestment plan available. Price Growth Persistence 35 2021 Value Une, Inc. All this served. For material obtained from sources bolleved to be reliable and is provided without wutarties of my kind. Earnings Predictability 100 THE PUBLISHER IS NOT RESPONSIBLE FOR ANY ERRORS OR OMISSIONS HEREN Trapublication is strictly for autocrbara cwn, non commercial, amal sa ho part to subscribe call 1-800-VALUELINE of t may be reproduced, sod, od or based in any printed, electronic v other form of used for generator mainan ini 2021