

Question
Fertility We have discussed in lecture that there are several different measures of fertility, each of which is more specific in terms of the number
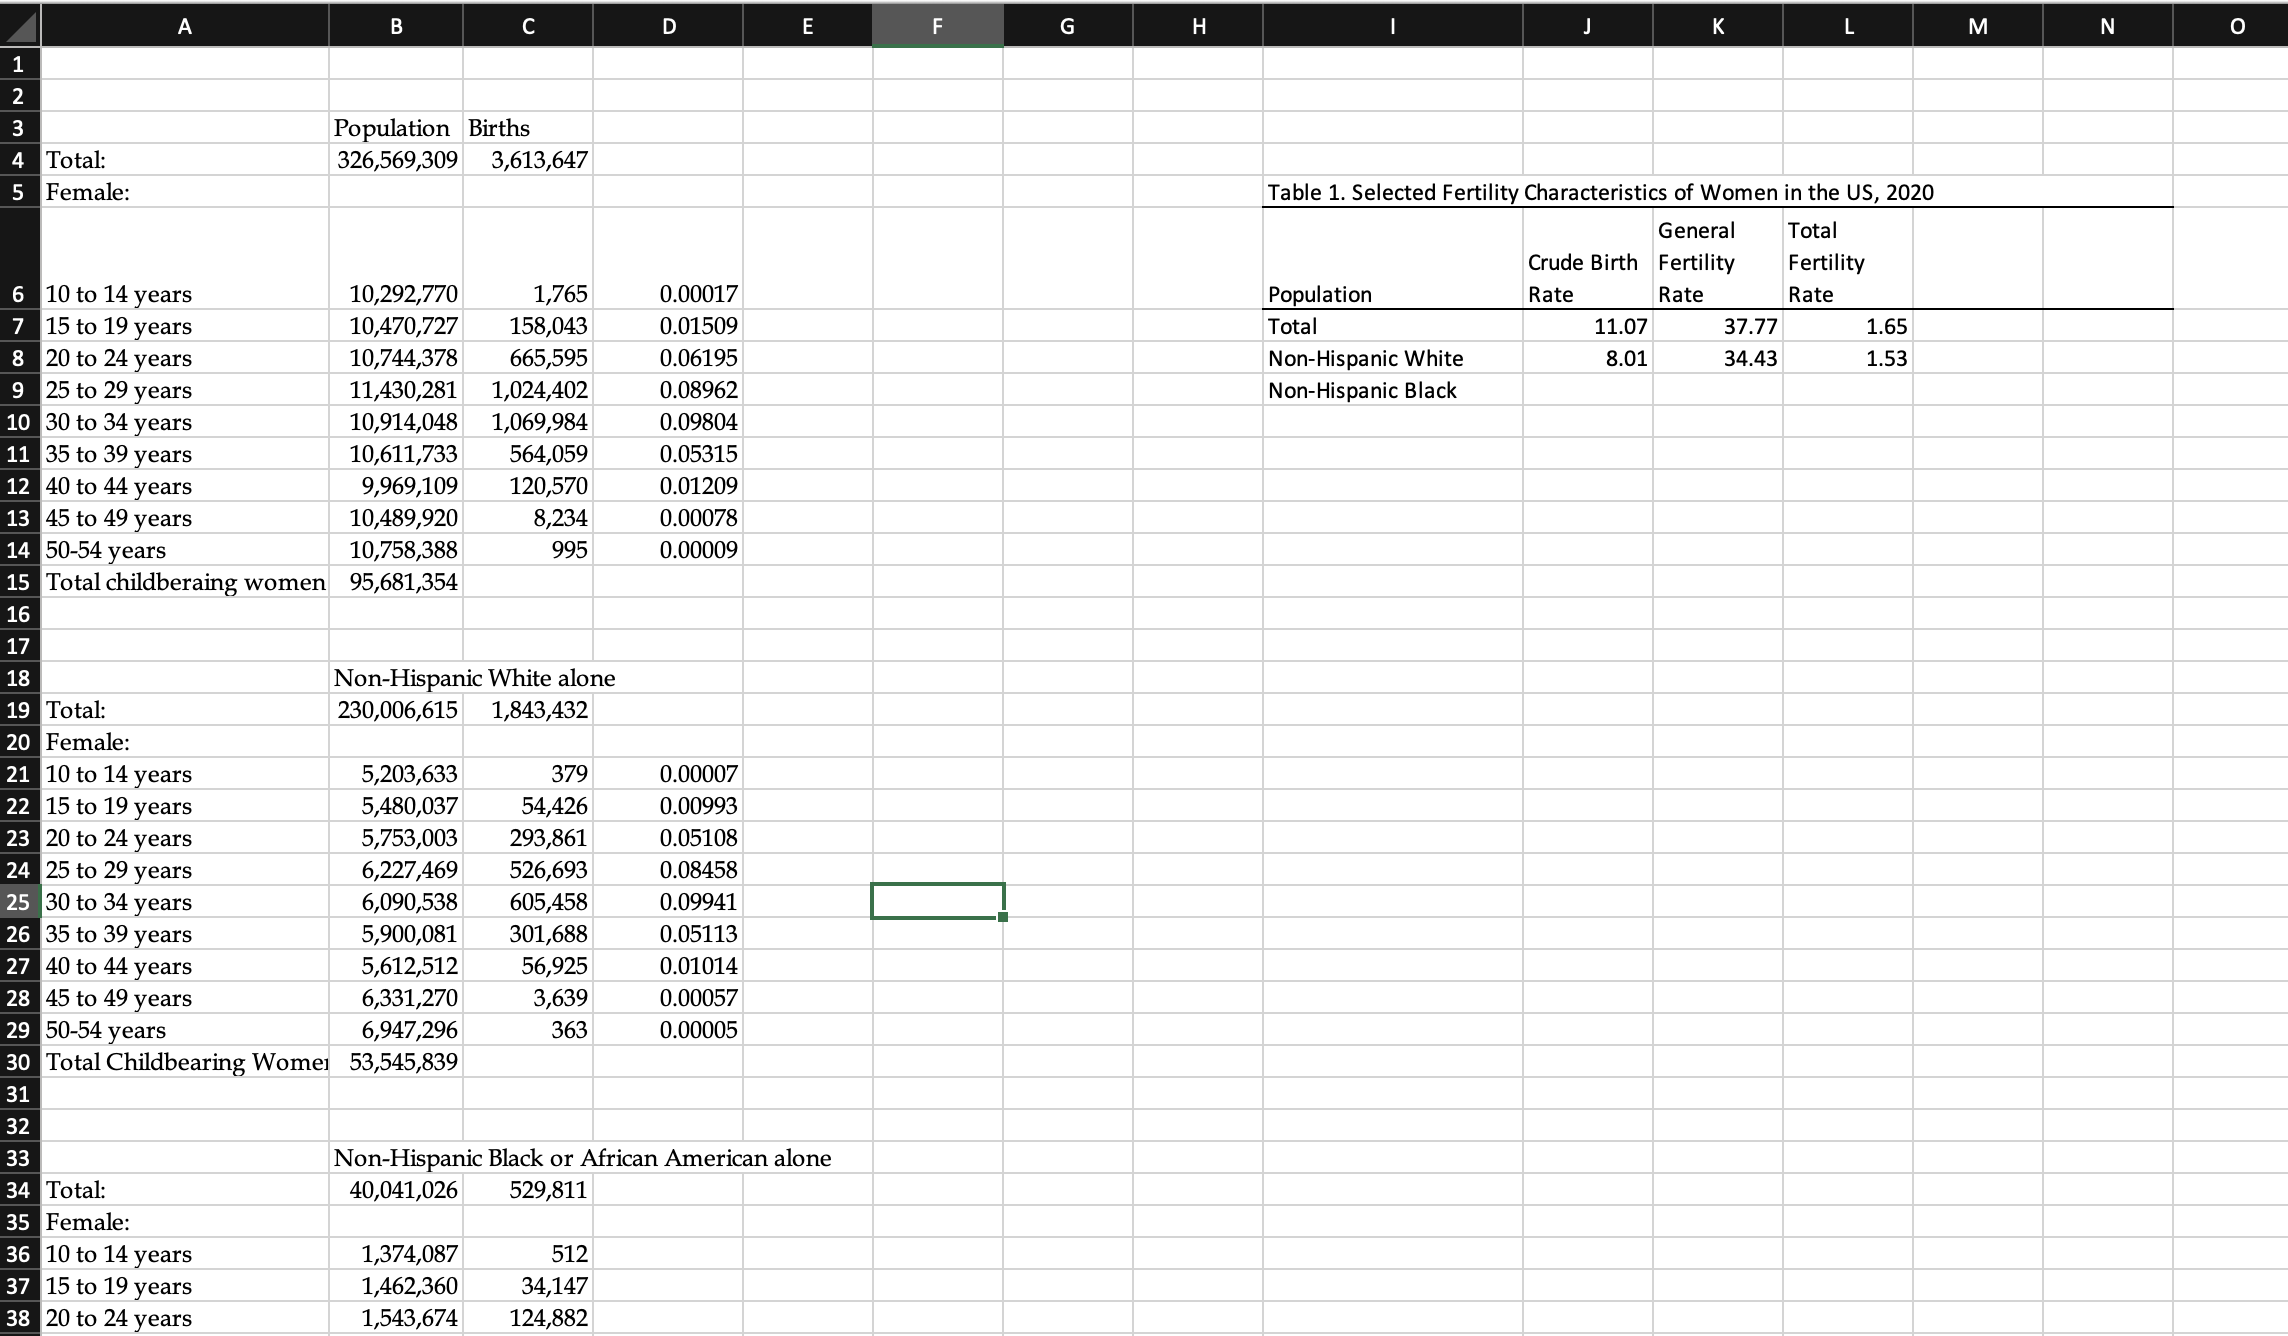
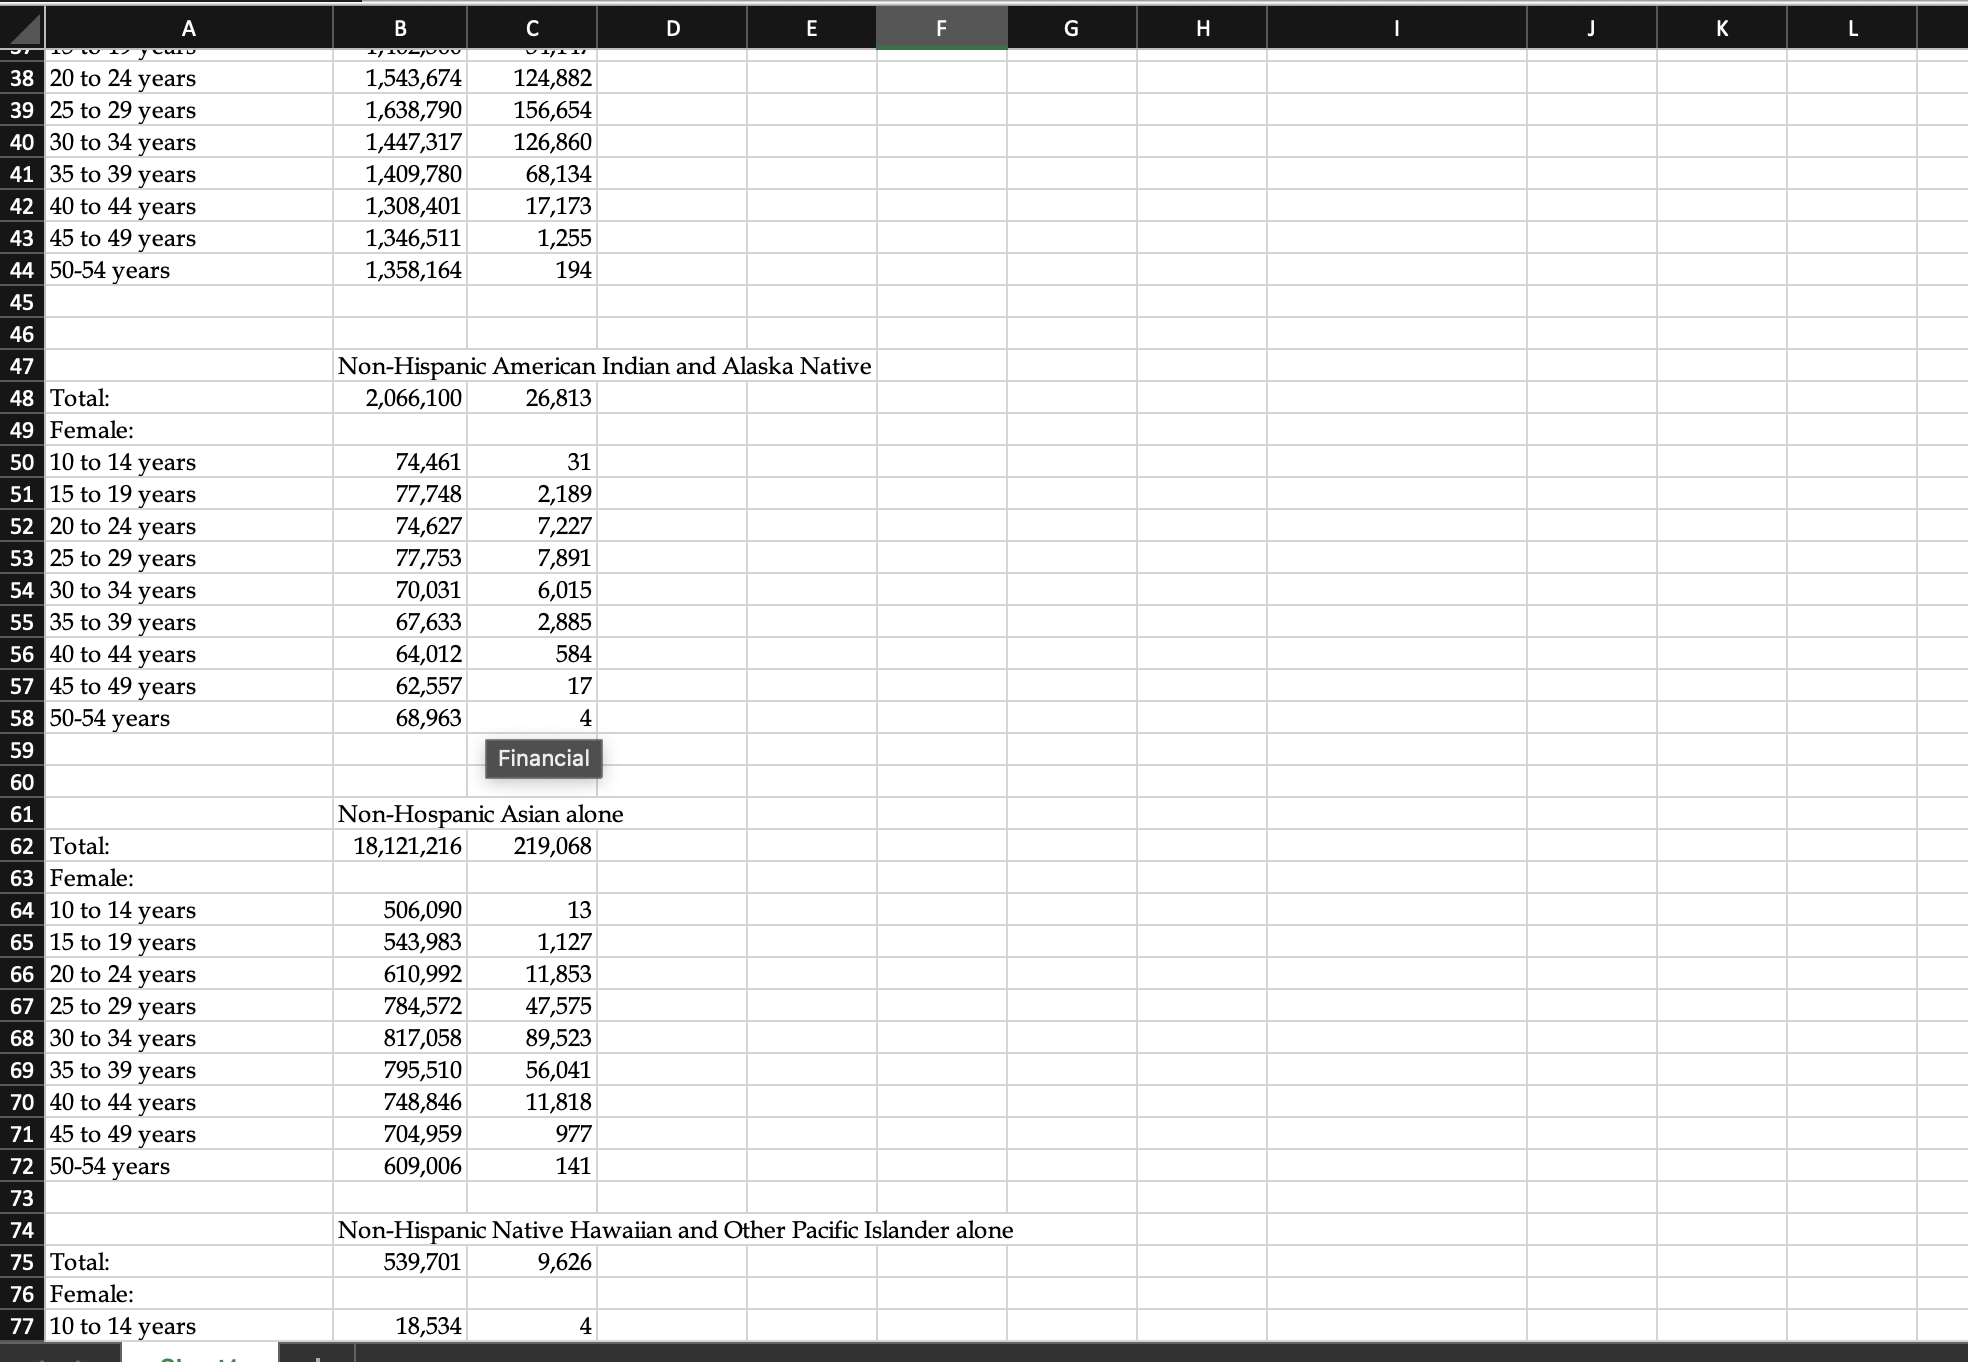
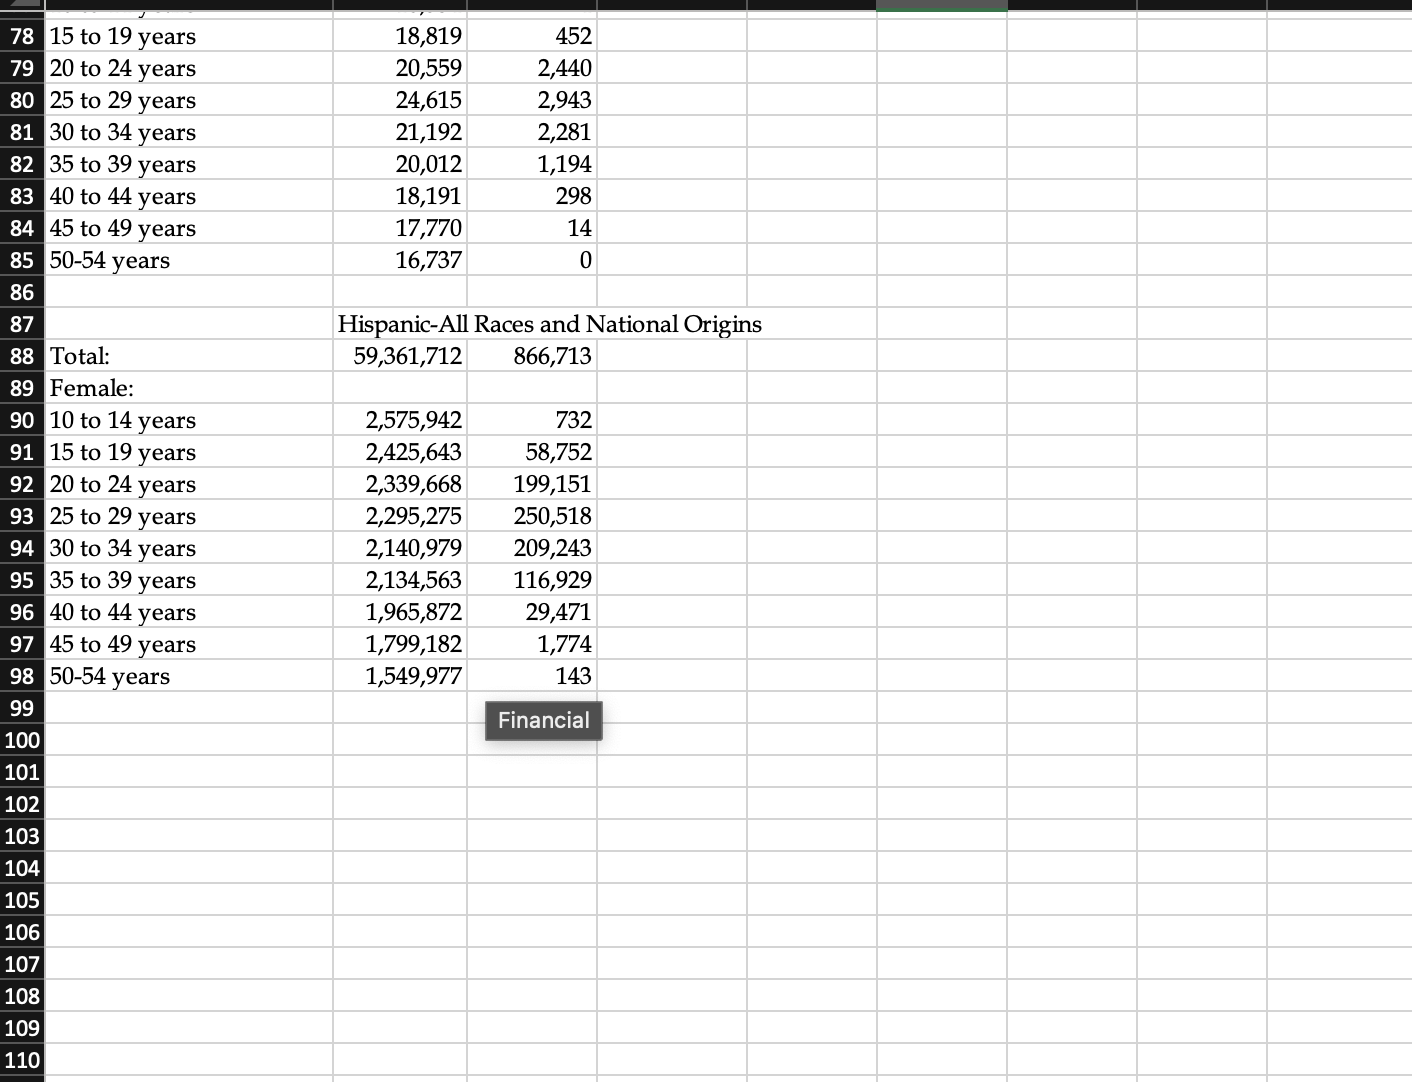
Fertility We have discussed in lecture that there are several different measures of fertility, each of which is more specific in terms of the number of births relative to the population "at risk" of giving birth. In this lab, you will be using data published by the National Center for Vital Statistics of the Center for Disease Control to compute these measures, and to see how fertility experiences differ across demographic groups in the U.S. Below are descriptions of each of the measures. I have created a data set with the 2020 American Community Survey and the 2020 birth data for the entire US, Non-Hispanic Whites, Non-Hispanic Blacks, Non-Hispanic Native Americans and alaska Natives, Non-Hispanic Asians, Non-Hispanic Native Hawaiians and Pacific Islanders, and Hispanics. You will compute the measures below for each group, and then in your write-up, you will compare and contrast these rates across the different groups. I did not add nativity, so do not assume these are native-born or foreign-born. While the Census Bureau disaggregates by nativity, the National Center for Vital Statistics does not. Crude Birth Rate The Crude Birth Rate is the simplest form of describing fertility in a culture, but as we saw in Lab 4, its primary uses are to compute rates of natural increase and momentum factors. The CBR does not really tell you much about how many children a typical family has. It has another inherent weakness. It uses the entire population as the denominator, thus including all males and all females not in their childbearing years. CBR = #live births/Total Population x 1000 General Fertility Rate The General Fertility Rate begins to control for population structure by computing the number of live births for the population of women in their childbearing years per thousand. It is similar to the CBR, but the denominator is the at risk population only. GFR = # live births//Population females (10-49 or 54) depending on how a country reports its statistics x 1000. Age-Specific Fertility Rate The Age-Specific Fertility Rate is similar to the age-specific mortality rate in that it measures how many births there are to women in specific age cohorts. This is a helpful statistic in understanding what the typical childbearing age is in a culture. The age cohort(s) with the highest rate(s) tell you when childbearing most commonly occurs in a typical woman's life in that culture. ASFR = # live births to women in an age cohort/Population of women in that age cohort Total Fertility Rate The Total Fertility Rate or TFR is the most powerful and useful measure of fertility in understanding a population. It represents the number of children the typical woman in that population will have over her childbearing years, based on 2 assumptions: Women will have the same birth rates over their lifetimes as women in different age cohorts in that same population have had in that year; and Women will survive through their childbearing years. TFR=h ? ASFR Where h=the number of years in the age cohorts for the ASFR. You will be using data found in Lab 6.xlsx to compute the CBR, GFR, ASFRs and TFR for the US for the year 2020.
- You will repeat this for each group. You will create a table for each group of AFSR. You will also create a separate table summarizing CBR, GFR, and TFR for all the groups. Remember that you must include all of your results tables, and that you compare and contrast your results. Your sources are the 2020 American Community Survey 5-year file and the National Vital Statistics Reports, Vol. 70, Num. 17, Table 3, published February 7, 2022.
Step by Step Solution
There are 3 Steps involved in it
Step: 1

Get Instant Access to Expert-Tailored Solutions
See step-by-step solutions with expert insights and AI powered tools for academic success
Step: 2

Step: 3
Ace Your Homework with AI
Get the answers you need in no time with our AI-driven, step-by-step assistance
Get Started
Elementary Linear Algebra with Applications
Authors: Bernard Kolman, David Hill
9th edition
132296543, 978-0132296540