

Answered step by step
Verified Expert Solution
Question
1 Approved Answer
TABLE 2 t DISTRIBUTION Area or probability Entries in the table give t values for an area or probability in the upper tail of

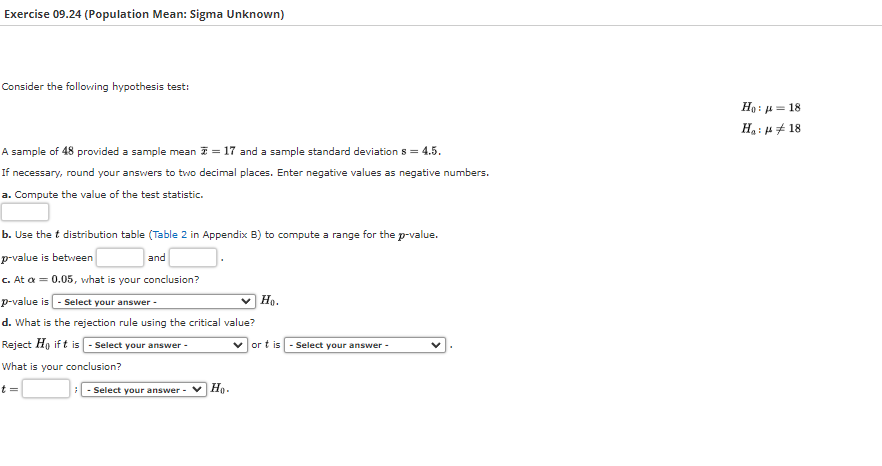

TABLE 2 t DISTRIBUTION Area or probability Entries in the table give t values for an area or probability in the upper tail of the t distribution. For example, with 10 degrees of freedom and a .05 area in the upper tail, = 1.812. Area in Upper Tail Degrees of Freedom 2 3 4 6 7 8 9 10 11 12 13 14 15 16 17 18 19 20 21 22 23 24 25 26 27 28 29 30 31 32 33 34 Degrees of Freedom 35 36 37 38 39 40 41 42 43 44 45 46 47 48 49 50 51 52 53 54 55 56 57 58 59 60 61 62 63 64 65 66 67 68 69 70 71 72 73 74 75 76 77 78 79 of Freedom 80 81 82 83 84 85 86 87 88 89 90 91 92 93 94 95 96 97 98 99 100 .20 1.376 1.061 .978 .941 .889 .883 .879 .876 .873 .870 .868 .865 .863 .862 .859 .858 .858 .857 .856 .856 .855 .855 .854 .853 .853 .853 .852 .852 .852 .851 .851 .851 .851 .850 .850 .850 .850 .850 .850 .849 .849 .849 .849 .849 .849 .848 .848 .848 .848 .848 .848 .848 .848 .848 .847 .847 .847 .847 .847 .847 .847 .847 .847 .847 .847 .847 .847 .846 .846 .846 .846 .846 .846 .845 .845 .845 .845 .845 .845 .845 .842 .10 3.078 1.886 1638 1533 1476 1.440 1415 1397 1383 1372 1363 1356 1350 1345 1341 1337 1333 1330 1328 1325 1323 1321 1319 1318 1316 1315 1314 1313 1.311 1310 1309 1.309 1.308 1307 .10 1.306 1.306 1.305 1.304 1.304 1.303 1.303 1.302 1.302 1.301 1.301 1.300 1.300 1.299 1.299 I .299 1.298 1.298 1.298 I .297 I .297 1.297 1.297 1.296 I .296 I .296 1.296 1.295 1.295 I .295 I .295 1.295 1.294 1.294 I .294 1.294 1.293 1.293 1.293 I .293 1.293 1.293 1.292 1.292 .10 1292 1292 1292 1292 1292 1292 1291 1291 1291 1291 1291 1291 1291 1291 1291 1291 1.290 1.290 1290 1.290 1.290 1282 .05 6.314 2.920 2.353 2.132 2.015 1943 I .895 1.860 I .833 1.812 1.796 I .782 1.771 1.761 I .753 1.746 1.740 1.734 1.729 1.725 1.721 1.717 1.714 1.711 1.708 1.706 I .703 1.701 I .699 1697 1696 1694 I .692 1.691 12.706 4.303 3.182 2176 2571 2.447 2.365 2.306 2.262 2.228 2.201 2.179 2.160 2.145 2.131 2.120 2.110 2.101 2.093 2.086 2.080 2.074 2.069 2.064 2.060 2.056 2.052 2.048 2.045 2.042 2.040 2.037 2.035 2.032 Area in Upper Tail .05 1.690 1.688 1.687 1.686 1.685 1.684 1.683 1.682 1.681 1.680 1.679 1.679 1.678 1.677 1.677 1.676 1.675 1.675 1.674 1.674 1.673 1.673 1.672 1.672 1.671 1.671 1.670 1.670 1.669 1.669 1.669 1.668 1.668 1.668 1.667 1.667 1.667 I -666 I -666 I -666 1.665 1.665 1.665 1.665 I -664 .025 2.030 2.028 2.026 2.024 2023 2.021 2.020 2018 2.017 2015 2.014 2.013 2.012 2.011 2010 2.ow 2.008 2.007 2.006 2005 2.0{ 2.003 2.002 2.002 2001 2.000 2.000 1.999 1.998 1998 1.997 1.997 1.996 1.995 1995 1.994 1.994 1.993 1.993 1993 1.992 1.992 1.991 1.991 Area in Upper Tail .05 1664 1664 1664 1663 1663 1663 1663 1663 I .662 1662 1662 I .662 I .662 I .661 I .661 I .661 I .661 I .661 I .661 1660 1660 1.645 1.990 1.990 1.989 1.989 1.989 1.988 1.988 1.988 1.987 1.987 1.987 1.986 1.986 1.986 1.986 1.985 1.985 1.985 1.984 1.984 1.984 1.960 .01 31.821 6.965 4.541 3.747 3365 3.143 2.998 2.896 2.821 2.764 2.718 2.681 2.650 2624 2.602 2.583 2.567 2.552 2539 2.528 2.518 2.508 2.500 2492 2.485 2.479 2.473 2.467 2462 2457 2453 2.449 2445 2441 .01 2438 2.434 2431 2429 2426 2423 2421 2418 2416 2414 2412 2.410 2.408 2407 2405 2.403 2.402 2.400 2.399 2397 2396 2395 2.394 2392 2391 2390 2389 2388 2.387 2386 2385 2384 2383 2.382 2382 2.381 2380 2379 2379 2378 2.377 2376 2376 2375 2.374 .01 2.374 2.373 2.373 2.372 2.372 2.371 2.370 2.370 2.369 2.369 2.368 2.368 2.368 2.367 2.367 2.366 2.366 2.365 2.365 2.364 2.364 2.326 63.656 9.925 5.841 4.604 4.032 3.707 3.499 3.355 3.250 3.169 3.106 3.055 3.012 2.977 2.947 2.921 2.898 2.878 2.861 2.845 2.831 2.819 2.807 2.797 2.787 2.779 2.771 2.763 2.756 2.750 2.744 2.738 2.733 2.728 2.724 2.719 2.715 2.712 2.708 2.704 2.701 2698 2695 2692 2.690 2.687 2.685 2682 2680 2678 2676 2674 2672 2670 2668 2667 2.665 2.663 2662 2660 2659 2657 2656 2655 2654 2652 2651 2650 2.649 2648 2647 2646 2645 2644 2.643 2642 2641 2640 2639 .oos 2.639 2.638 2.637 2.636 2.636 2.635 2.634 2.634 2.633 2.632 2.632 2.631 2.630 2.630 2.629 2.629 2.628 2.627 2.627 2.626 2.626 2.576
Step by Step Solution
There are 3 Steps involved in it
Step: 1

Get Instant Access to Expert-Tailored Solutions
See step-by-step solutions with expert insights and AI powered tools for academic success
Step: 2

Step: 3
Ace Your Homework with AI
Get the answers you need in no time with our AI-driven, step-by-step assistance
Get Started
Using SPSS For Windows And Macintosh Analyzing And Understanding Data
Authors: Samuel B Green, Neil J Salkind
6th Edition
0205893074, 9780205893072