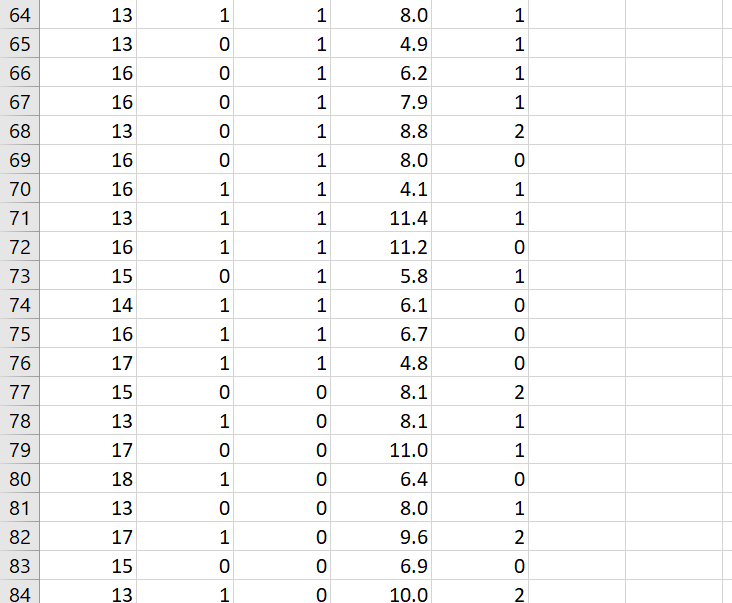
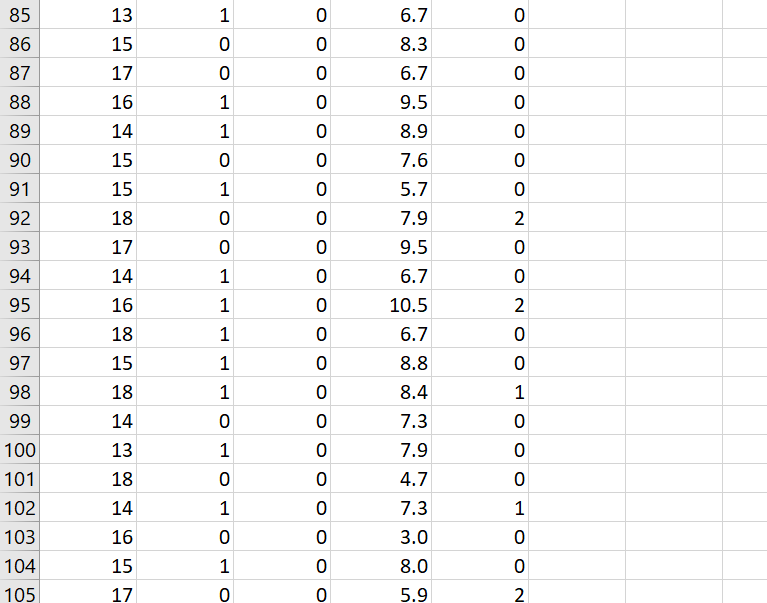
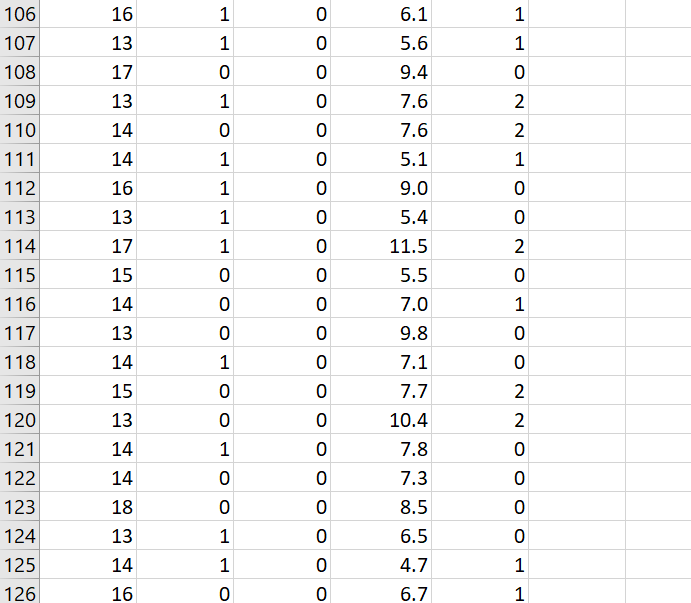
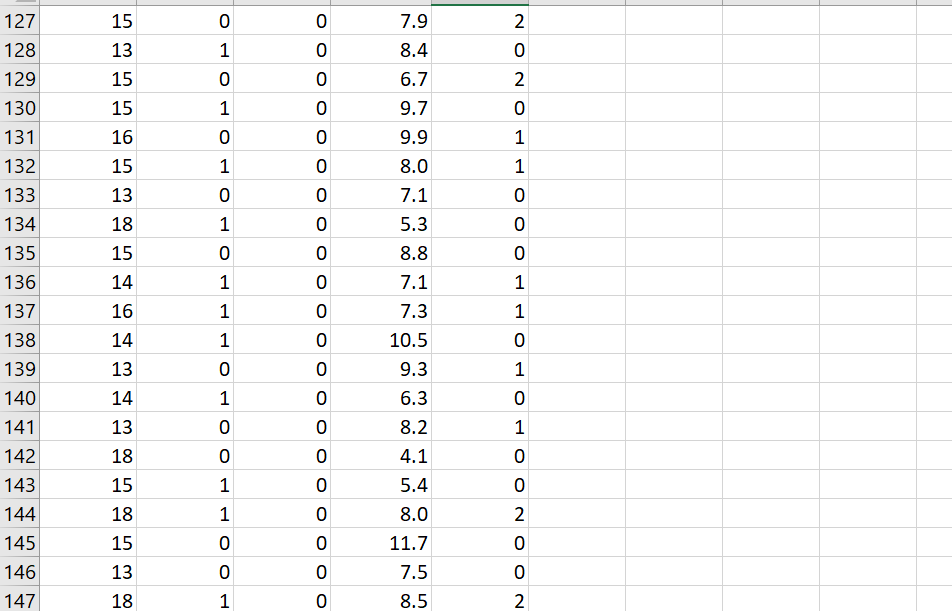
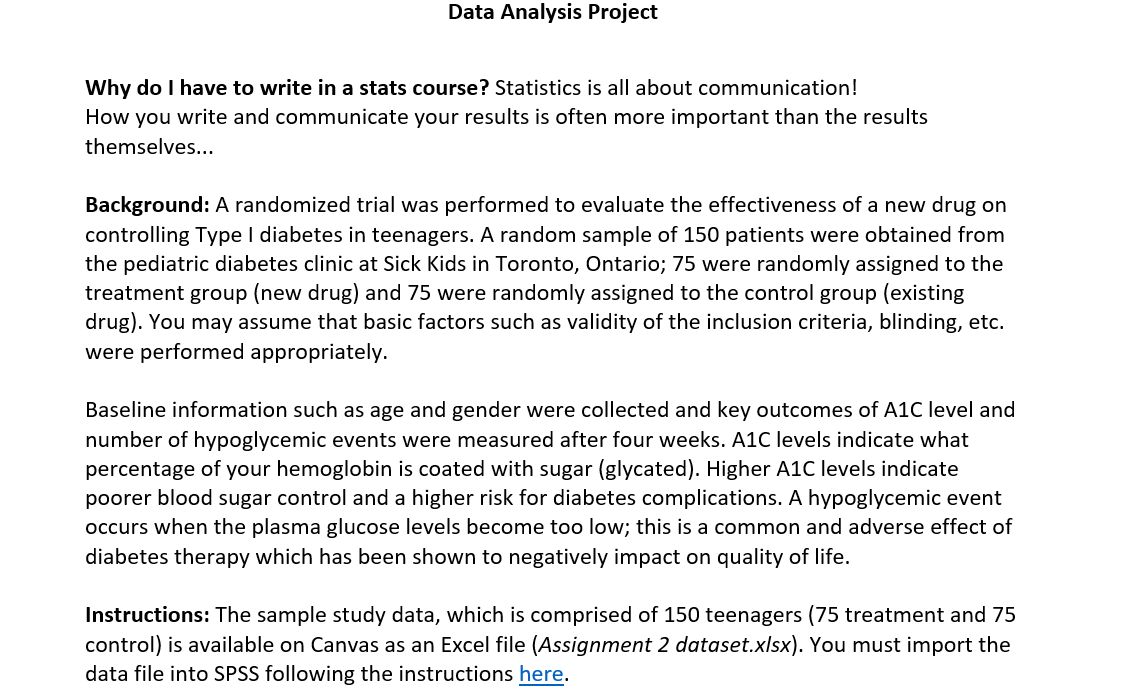
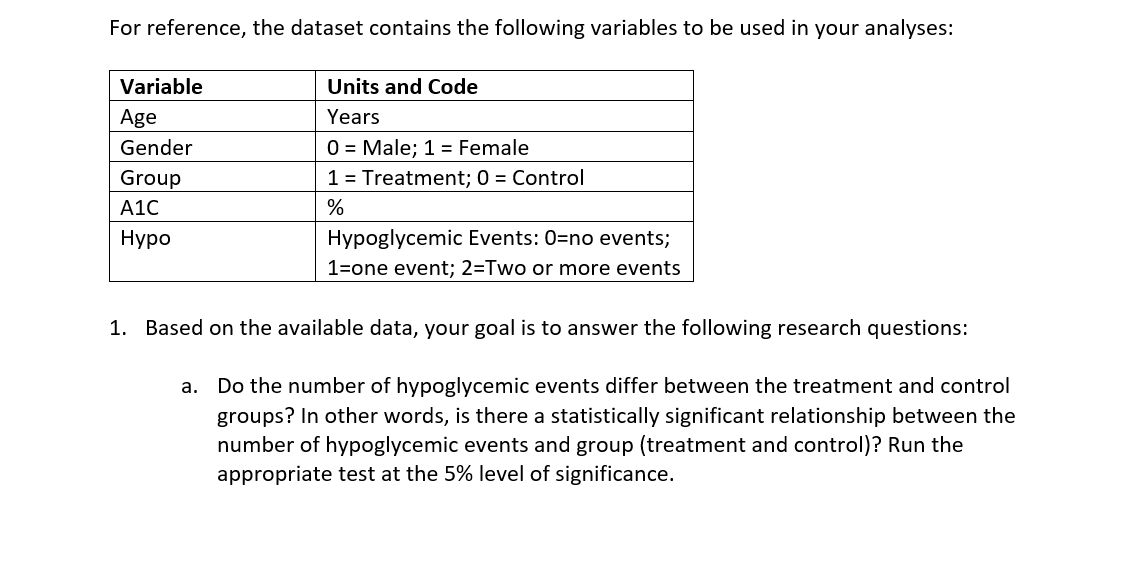
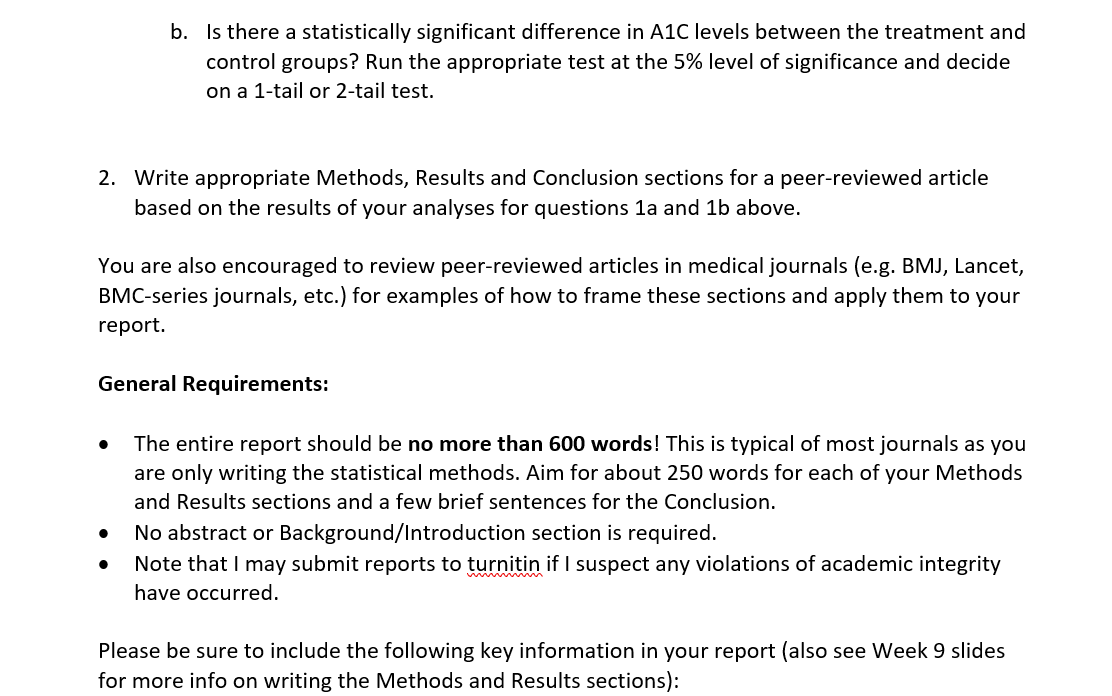
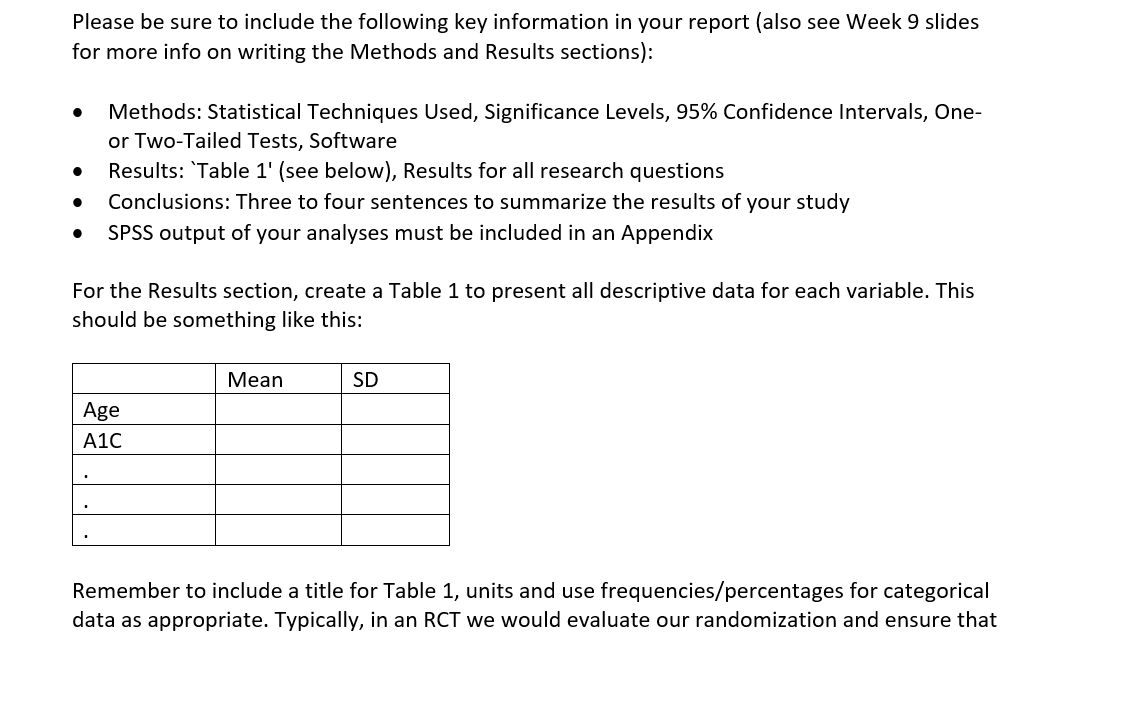
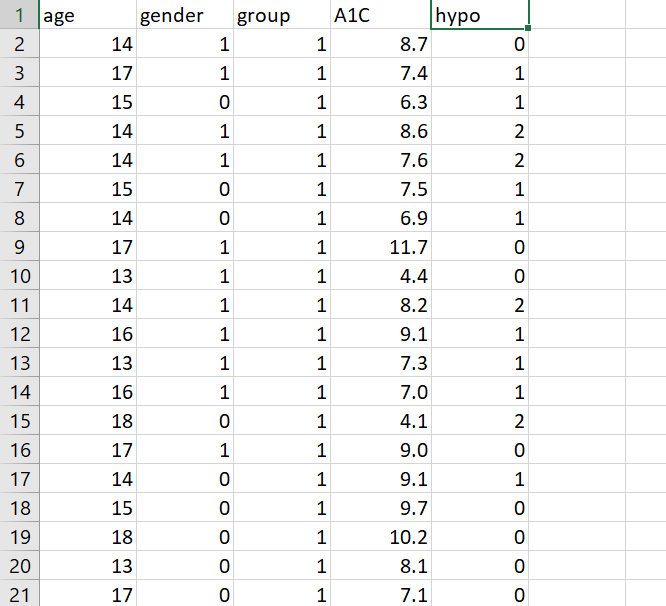
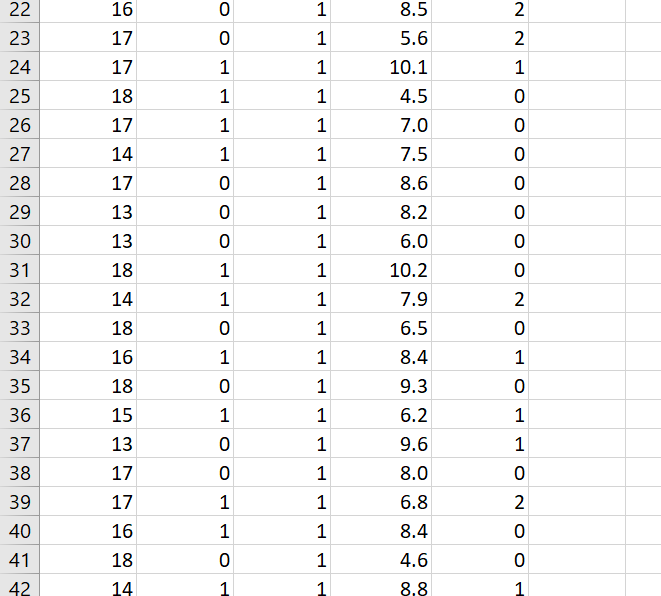
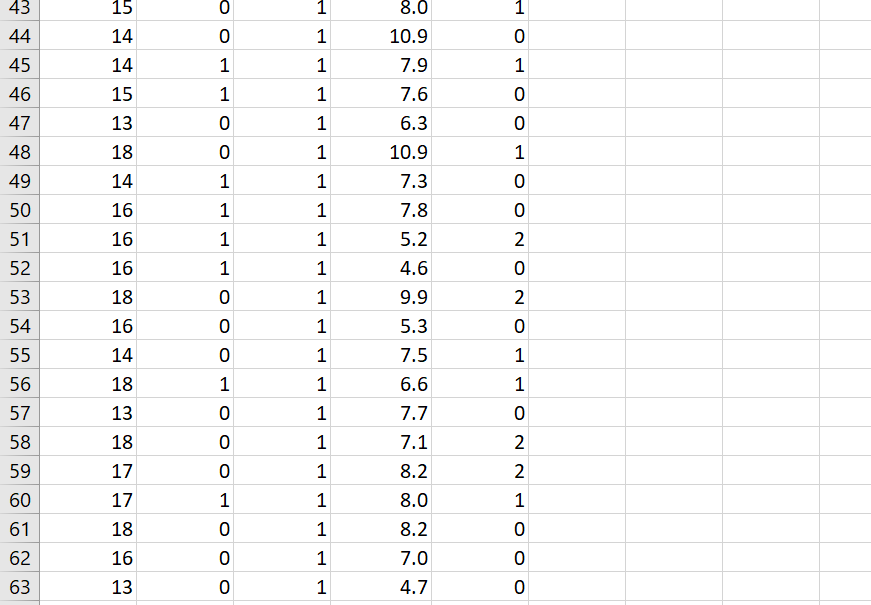
\f\f\f\f\fData Analysis Project Why do I have to write in a stats course? Statistics is all about communication! How you write and communicate your results is often more important than the results themselves... Background: A randomized trial was performed to evaluate the effectiveness of a new drug on controlling Type I diabetes in teenagers. A random sample of 150 patients were obtained from the pediatric diabetes clinic at Sick Kids in Toronto, Ontario; 75 were randomly assigned to the treatment group (new drug) and 75 were randomly assigned to the control group (existing drug). You may assume that basic factors such as validity of the inclusion criteria, blinding, etc. were performed appropriately. Baseline information such as age and gender were collected and key outcomes of AlC level and number of hypoglycemic events were measured after four weeks. AlC levels indicate what percentage of your hemoglobin is coated with sugar (glycated). Higher AlC levels indicate poorer blood sugar control and a higher risk for diabetes complications. A hypoglycemic event occurs when the plasma glucose levels become too low; this is a common and adverse effect of diabetes therapy which has been shown to negatively impact on quality of life. Instructions: The sample study data, which is comprised of 150 teenagers (75 treatment and 75 control) is available on Canvas as an Excel file (Assignment 2 datoset.xlsx). You must import the data file into SPSS following the instructions here. For reference, the dataset contains the following variables to be used in your analyses: Variable Units and Code Age Years Gender 0 = Male; 1 = Female Group 1 = Treatment; 0 = Control A1C % Hypo Hypoglycemic Events: O=no events; 1=one event; 2=Two or more events 1. Based on the available data, your goal is to answer the following research questions: Do the number of hypoglycemic events differ between the treatment and control groups? In other words, is there a statistically significant relationship between the number of hypoglycemic events and group (treatment and control)? Run the appropriate test at the 5% level of significance. b. Is there a statistically significant difference in AK levels between the treatment and control groups? Run the appropriate test at the 5% level of significance and decide on a l-tail or 2-tail test. 2. Write appropriate Methods, Results and Conclusion sections for a peer-reviewed article based on the results of your analyses for questions 1a and 1b above. You are also encouraged to review peer-reviewed articles in medical journals (e.g. BMJ, Lancet, BMC-series journals, etc.) for examples of how to frame these sections and apply them to your report. General Requirements: 0 The entire report should be no more than 600 words! This is typical of most journals as you are only writing the statistical methods. Aim for about 250 words for each of your Methods and Results sections and a few brief sentences for the Conclusion. 0 No abstract or Background/Introduction section is required. 0 Note that I may submit reports to tu rnitin if I suspect any violations of academic integrity have occurred. Please be sure to include the following key information in your report (also see Week 9 slides for more info on writing the Methods and Results sections): Please be sure to include the following key information in your report (also see Week 9 slides for more info on writing the Methods and Results sections): 0 Methods: Statistical Techniques Used, Significance Levels, 95% Confidence Intervals, One- or Two-Tailed Tests, Software 0 Results: 'Ta ble 1' (see below), Results for all research questions 0 Conclusions: Three to four sentences to summarize the results of your study 0 SPSS output of your analyses must be included in an Appendix For the Results section, create a Table 1 to present all descriptive data for each variable. This should be something like this: Mean SD Age A1C Remember to include a title for Table 1, units and use frequencies/percentages for categorical data as appropriate. Typically, in an RCT we would evaluate our randomization and ensure that \f\f\f
