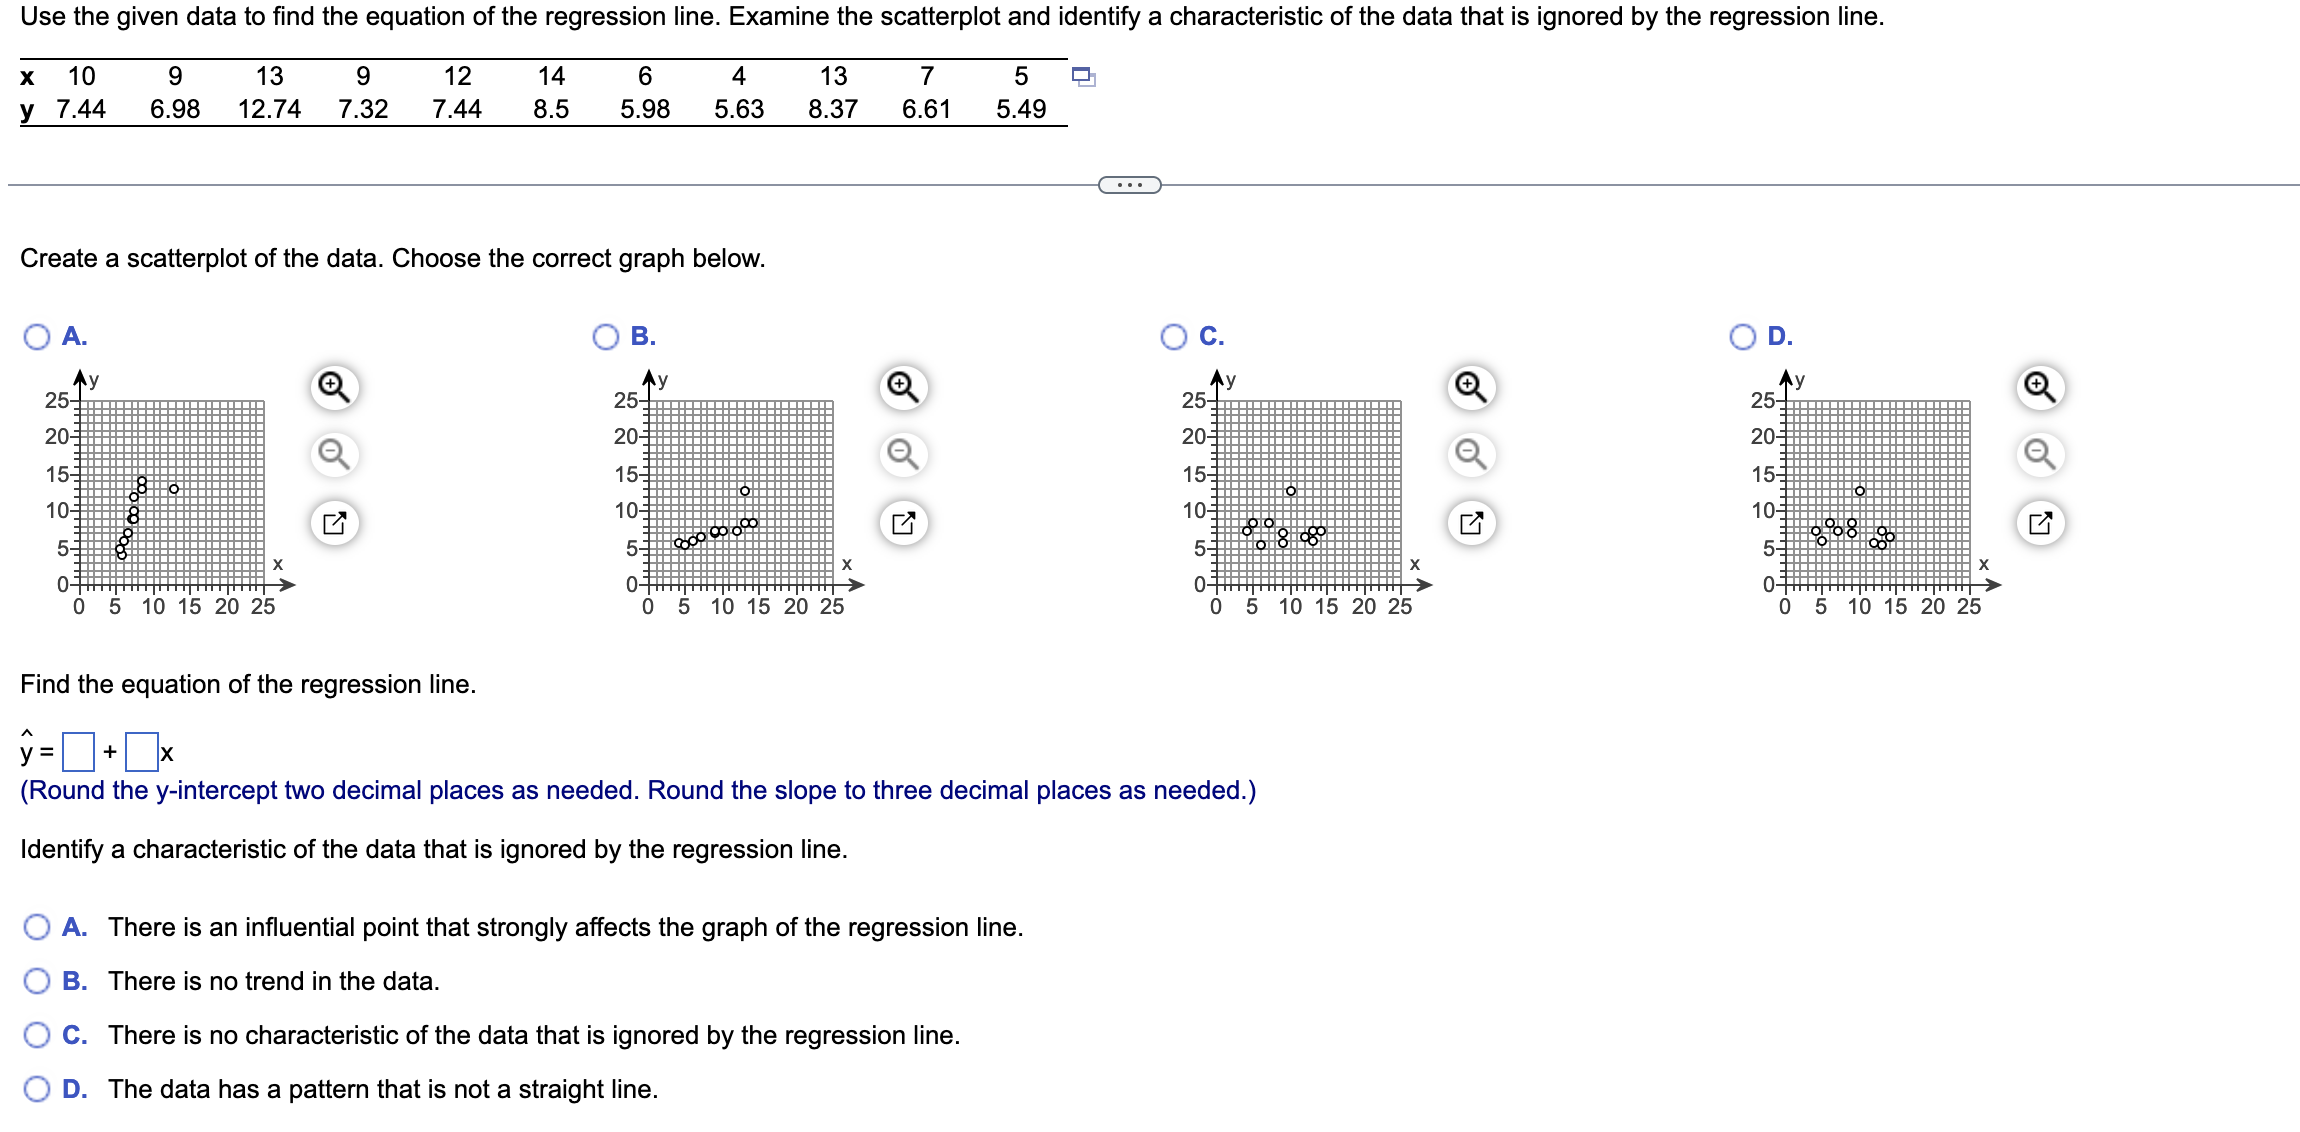
Fifty-four wild bears were anesthetized, and then their weights and chest sizes were measured and listed in a data set. Results are shown in the
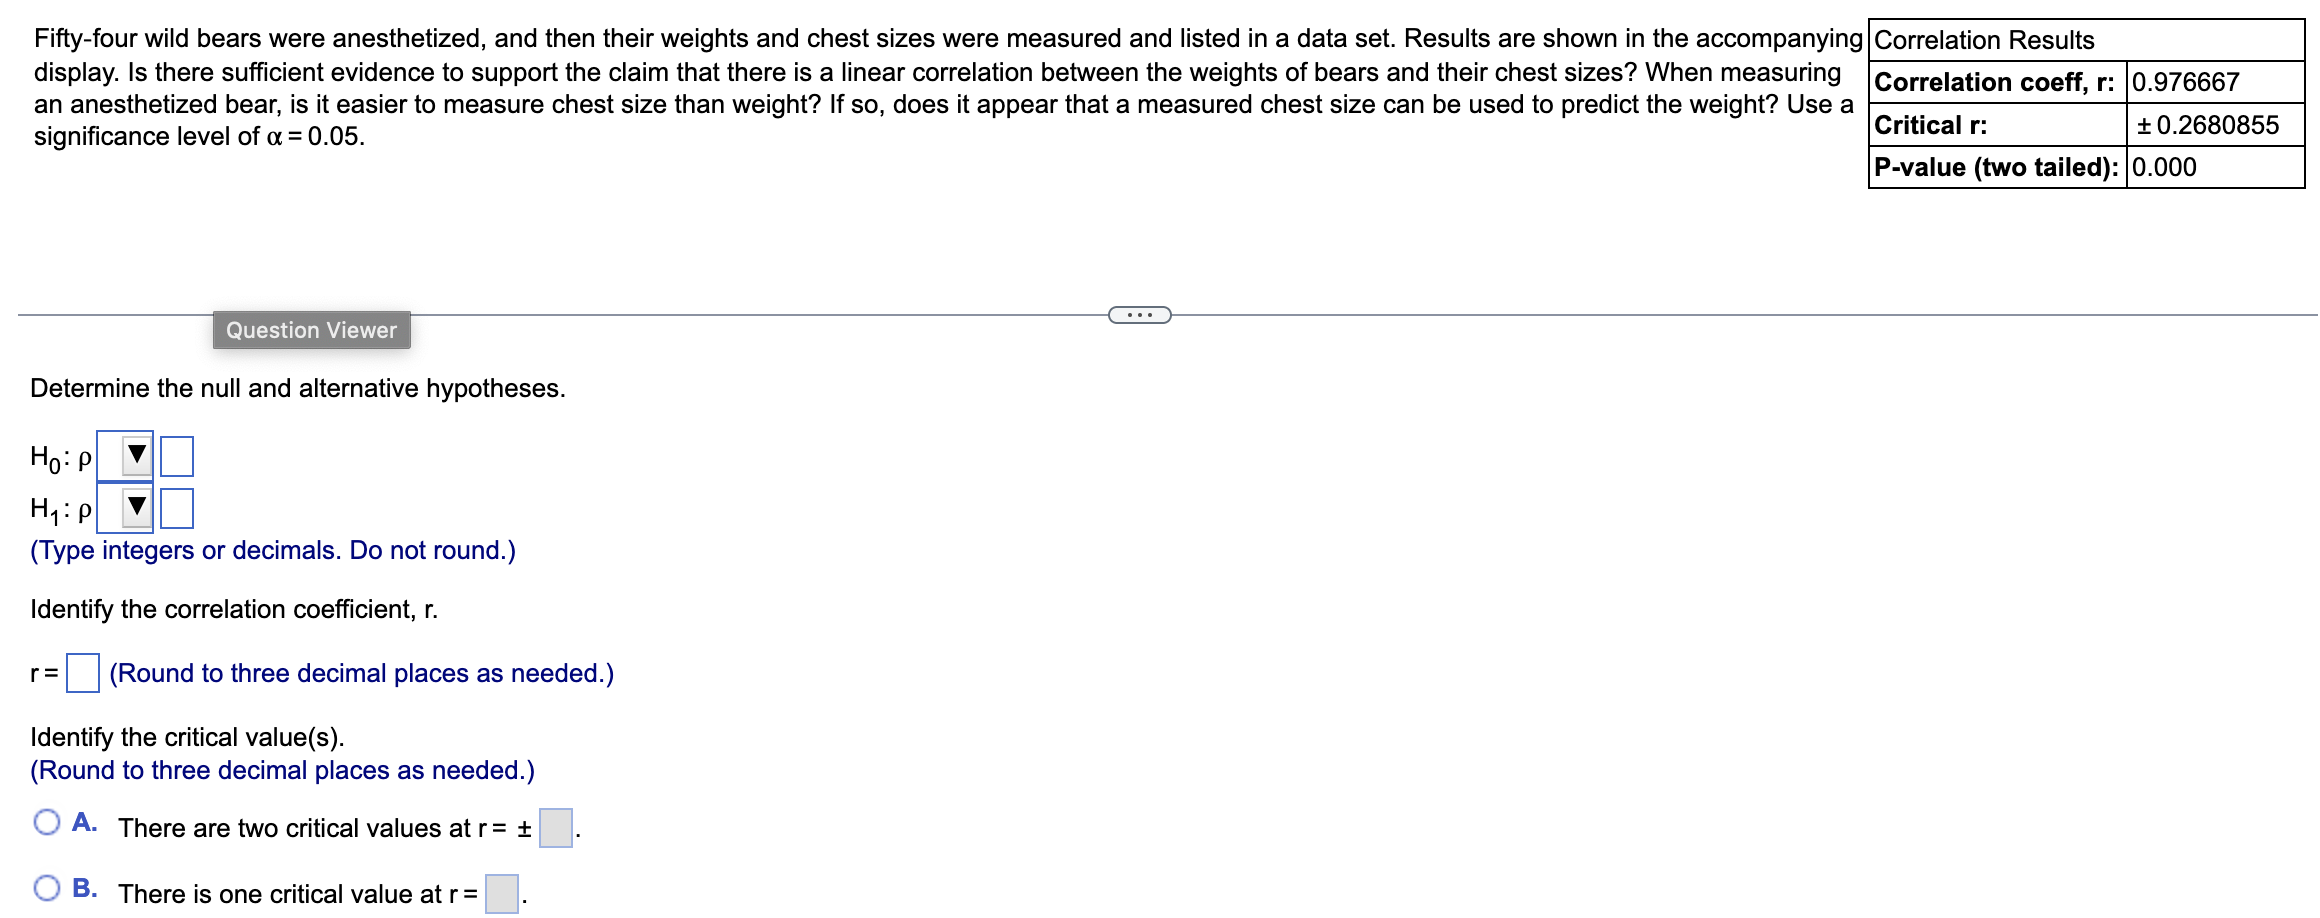
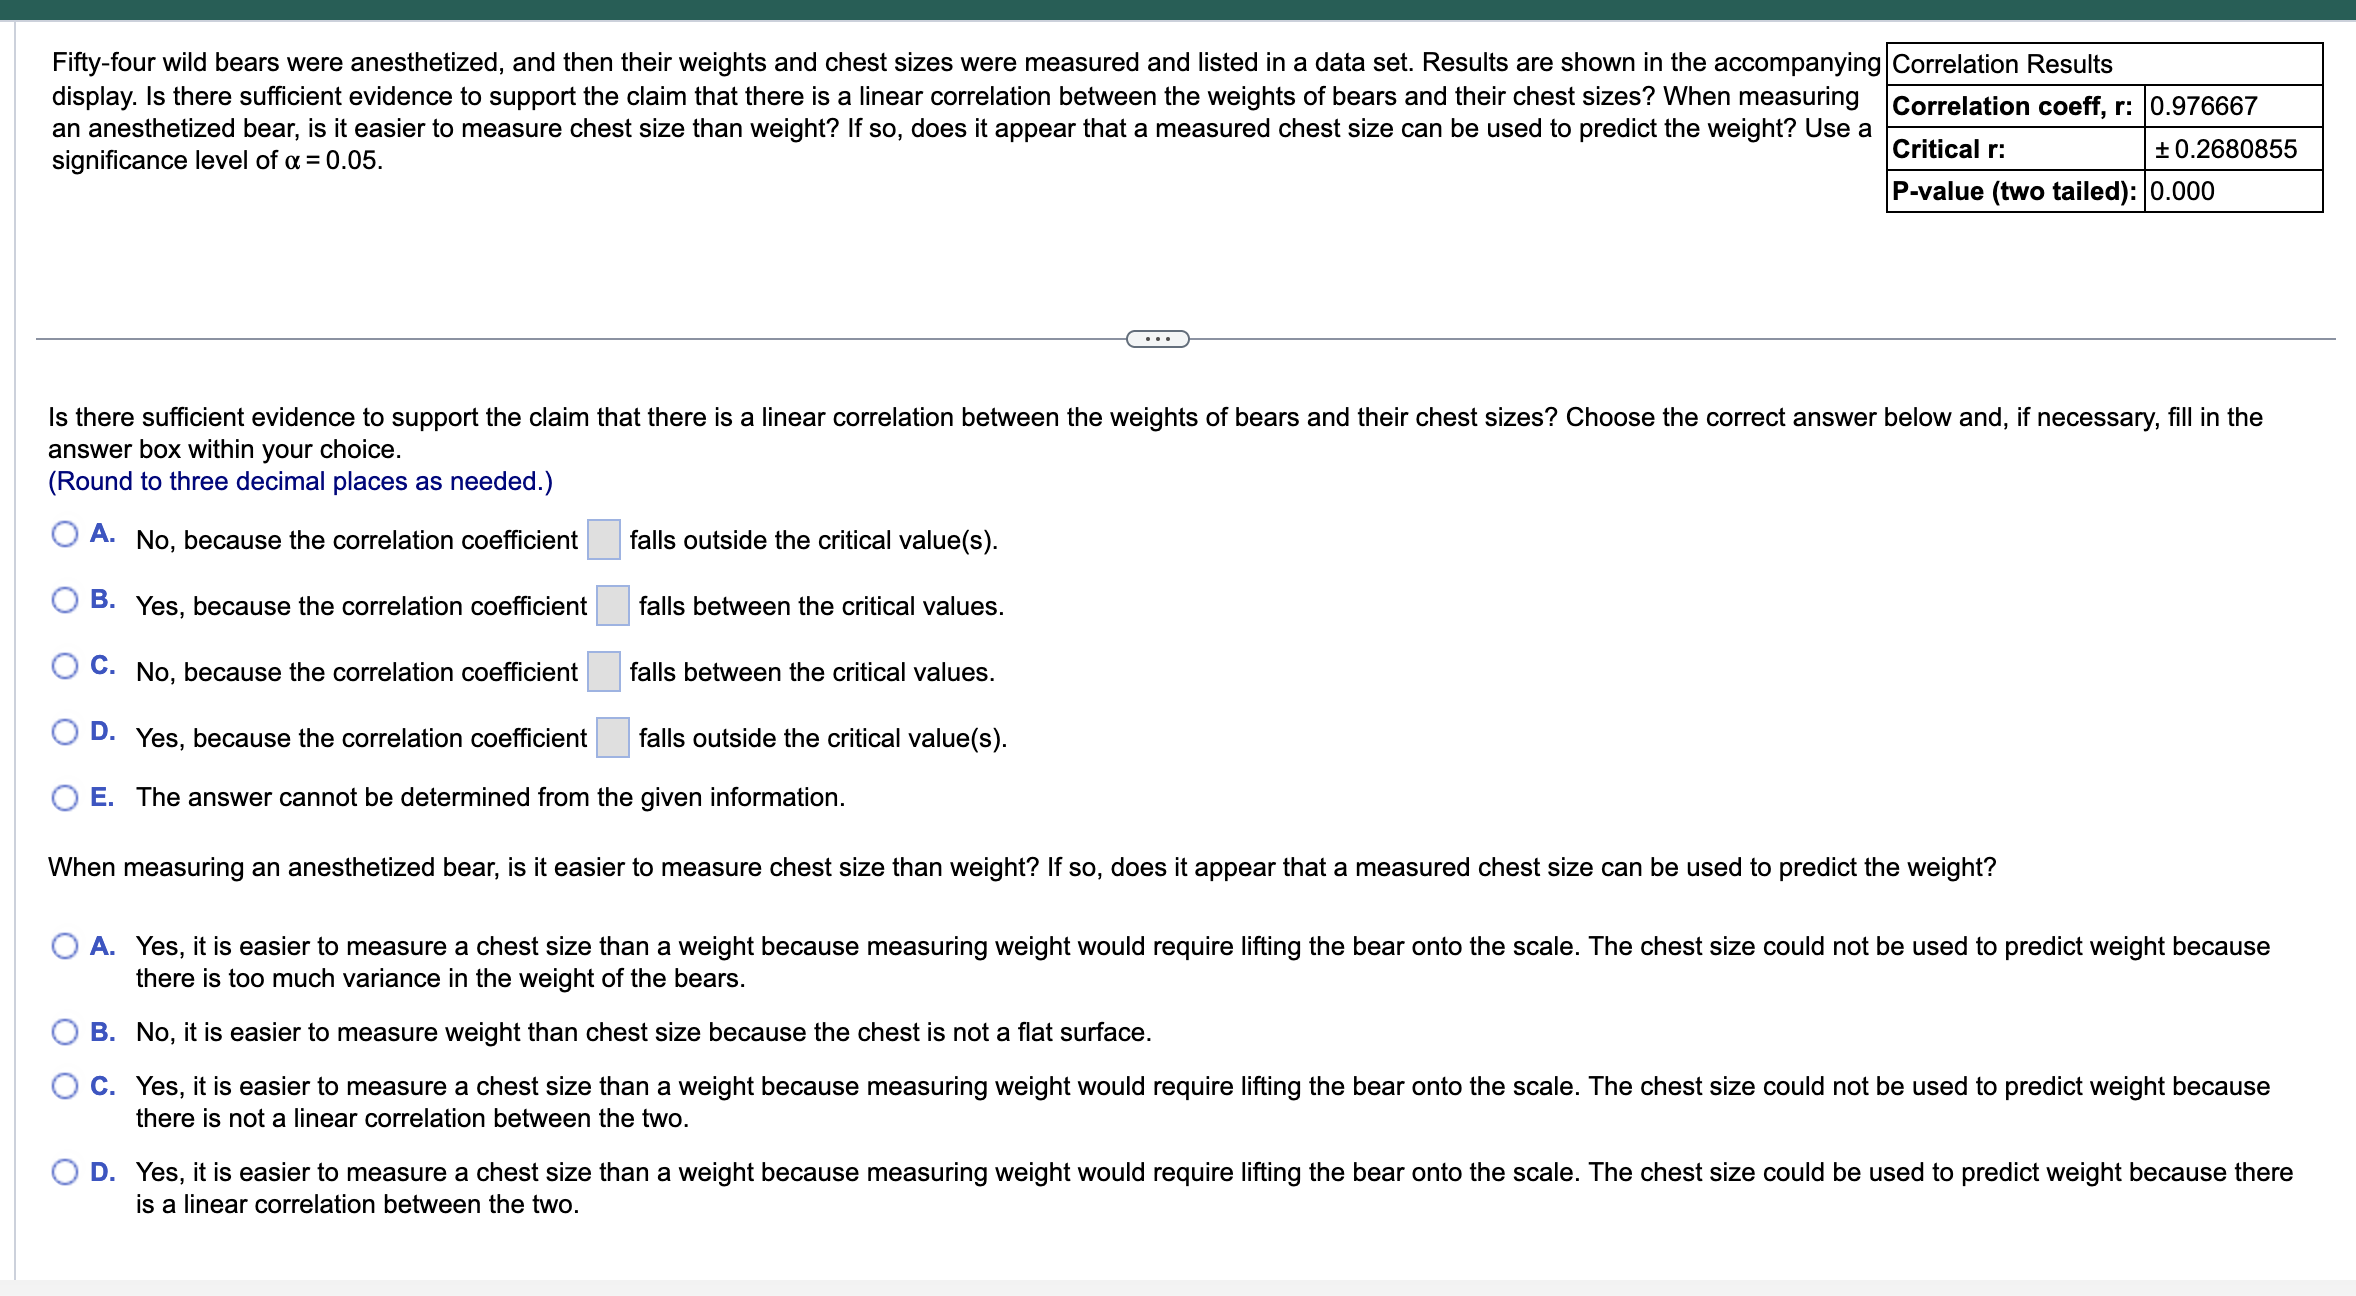
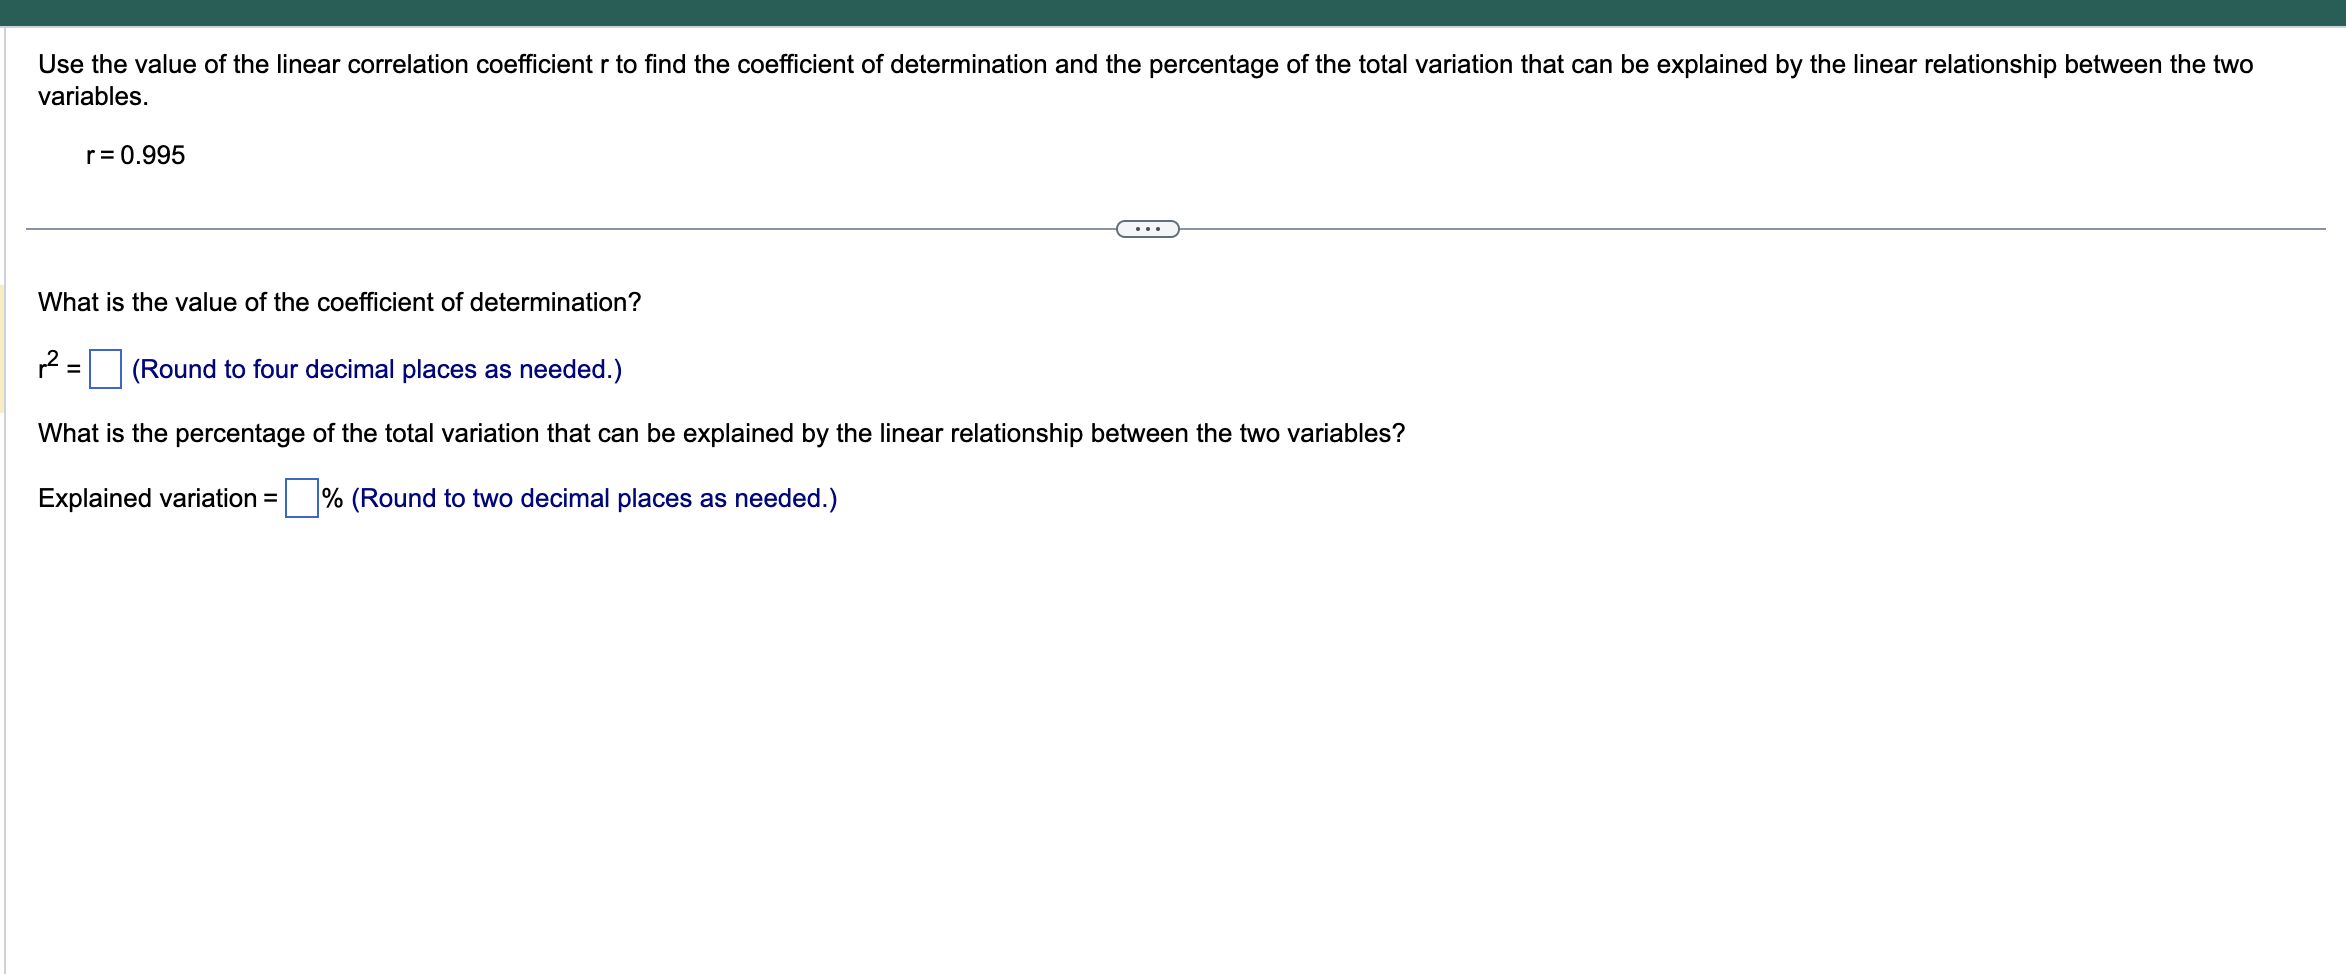
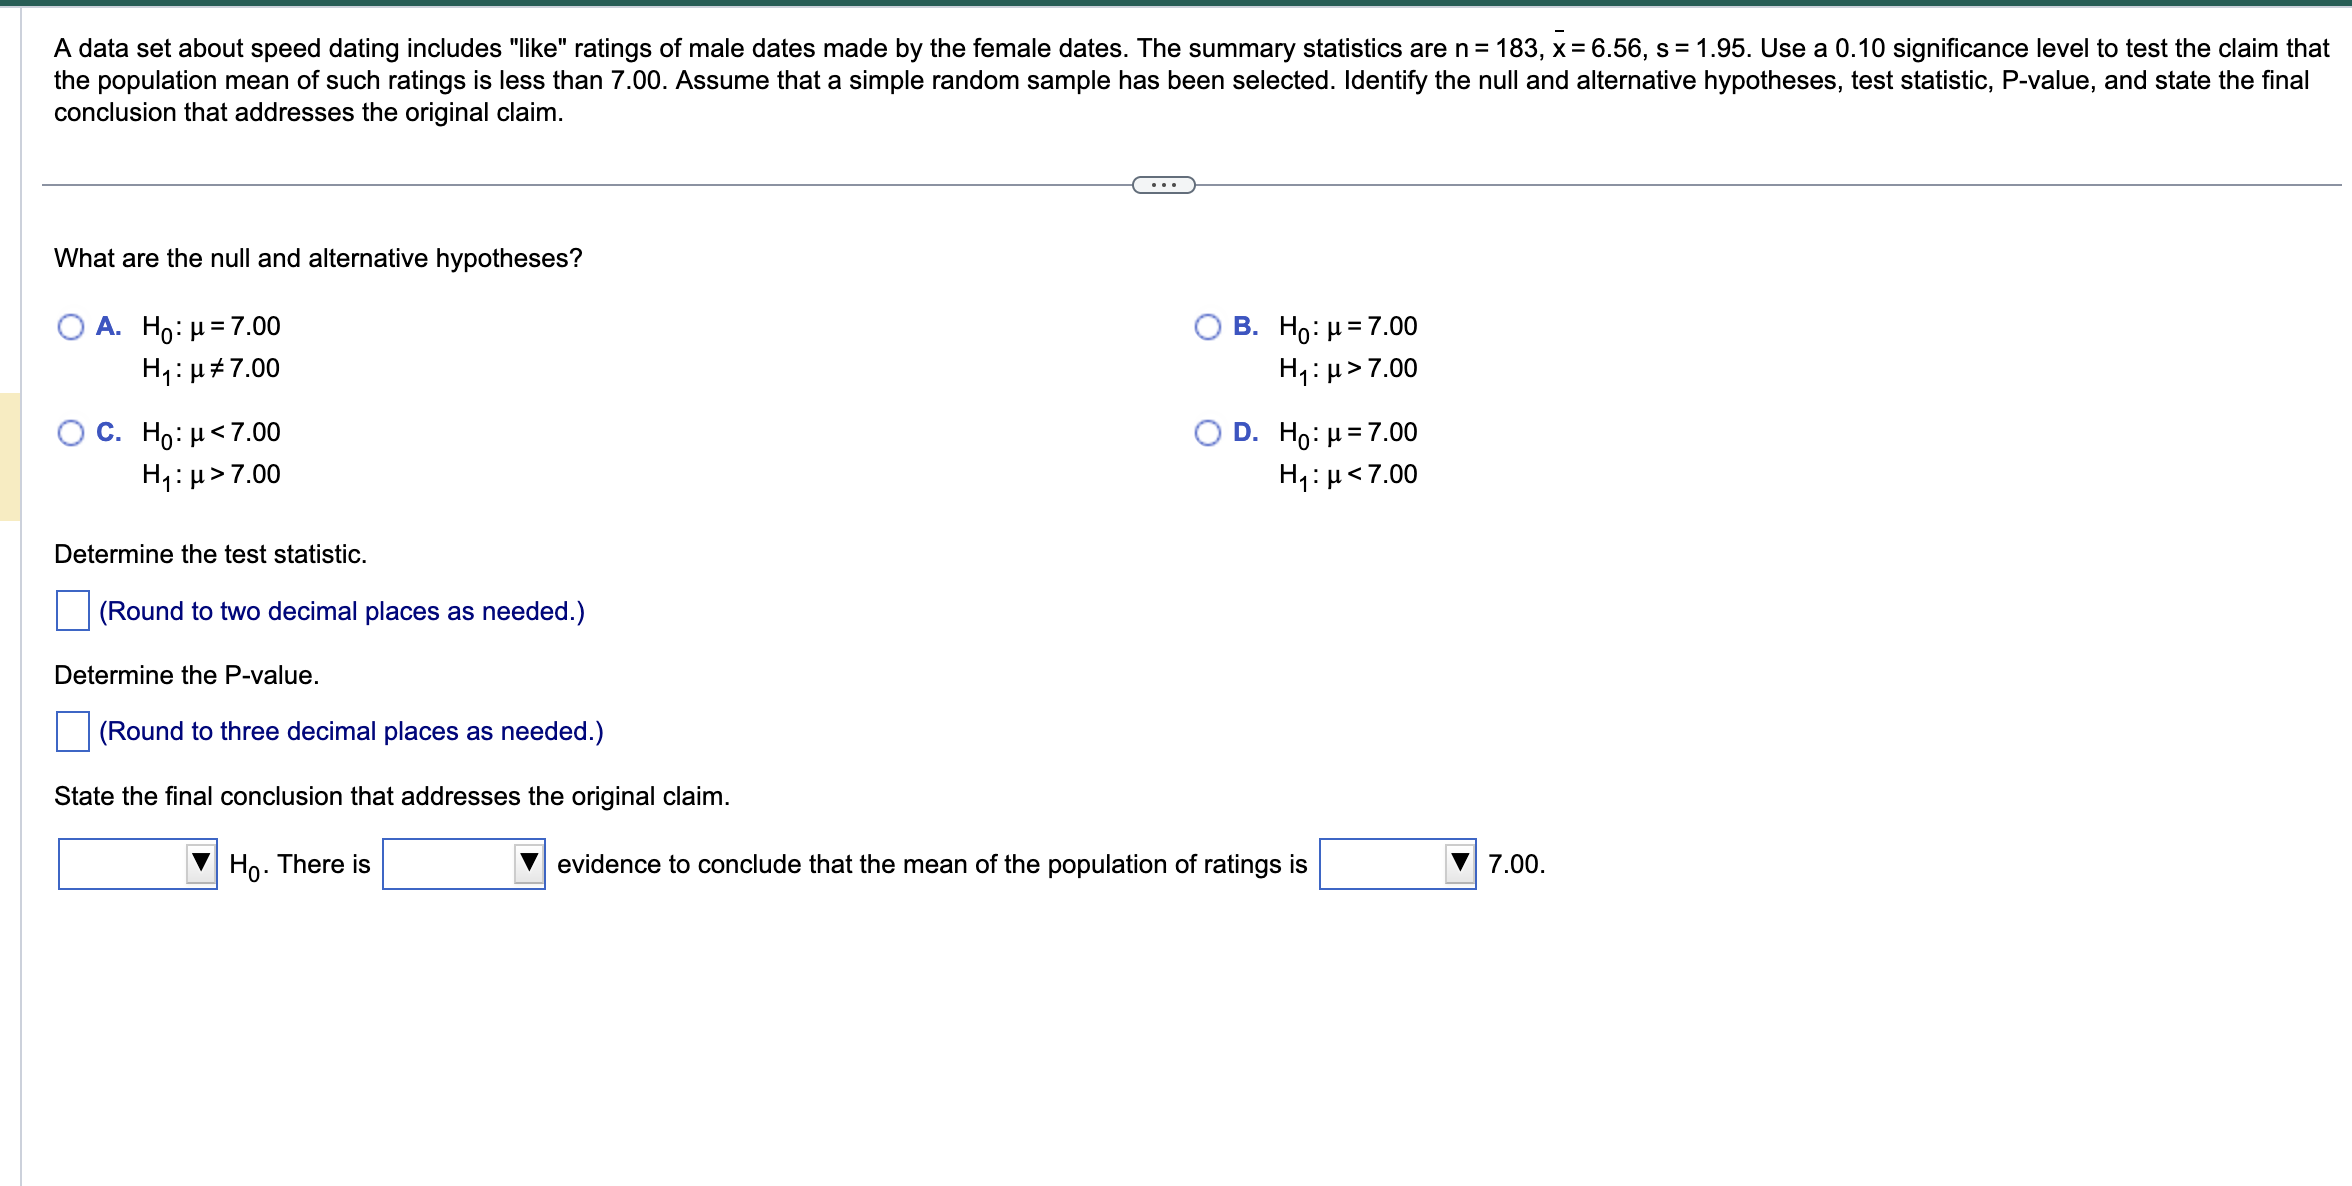
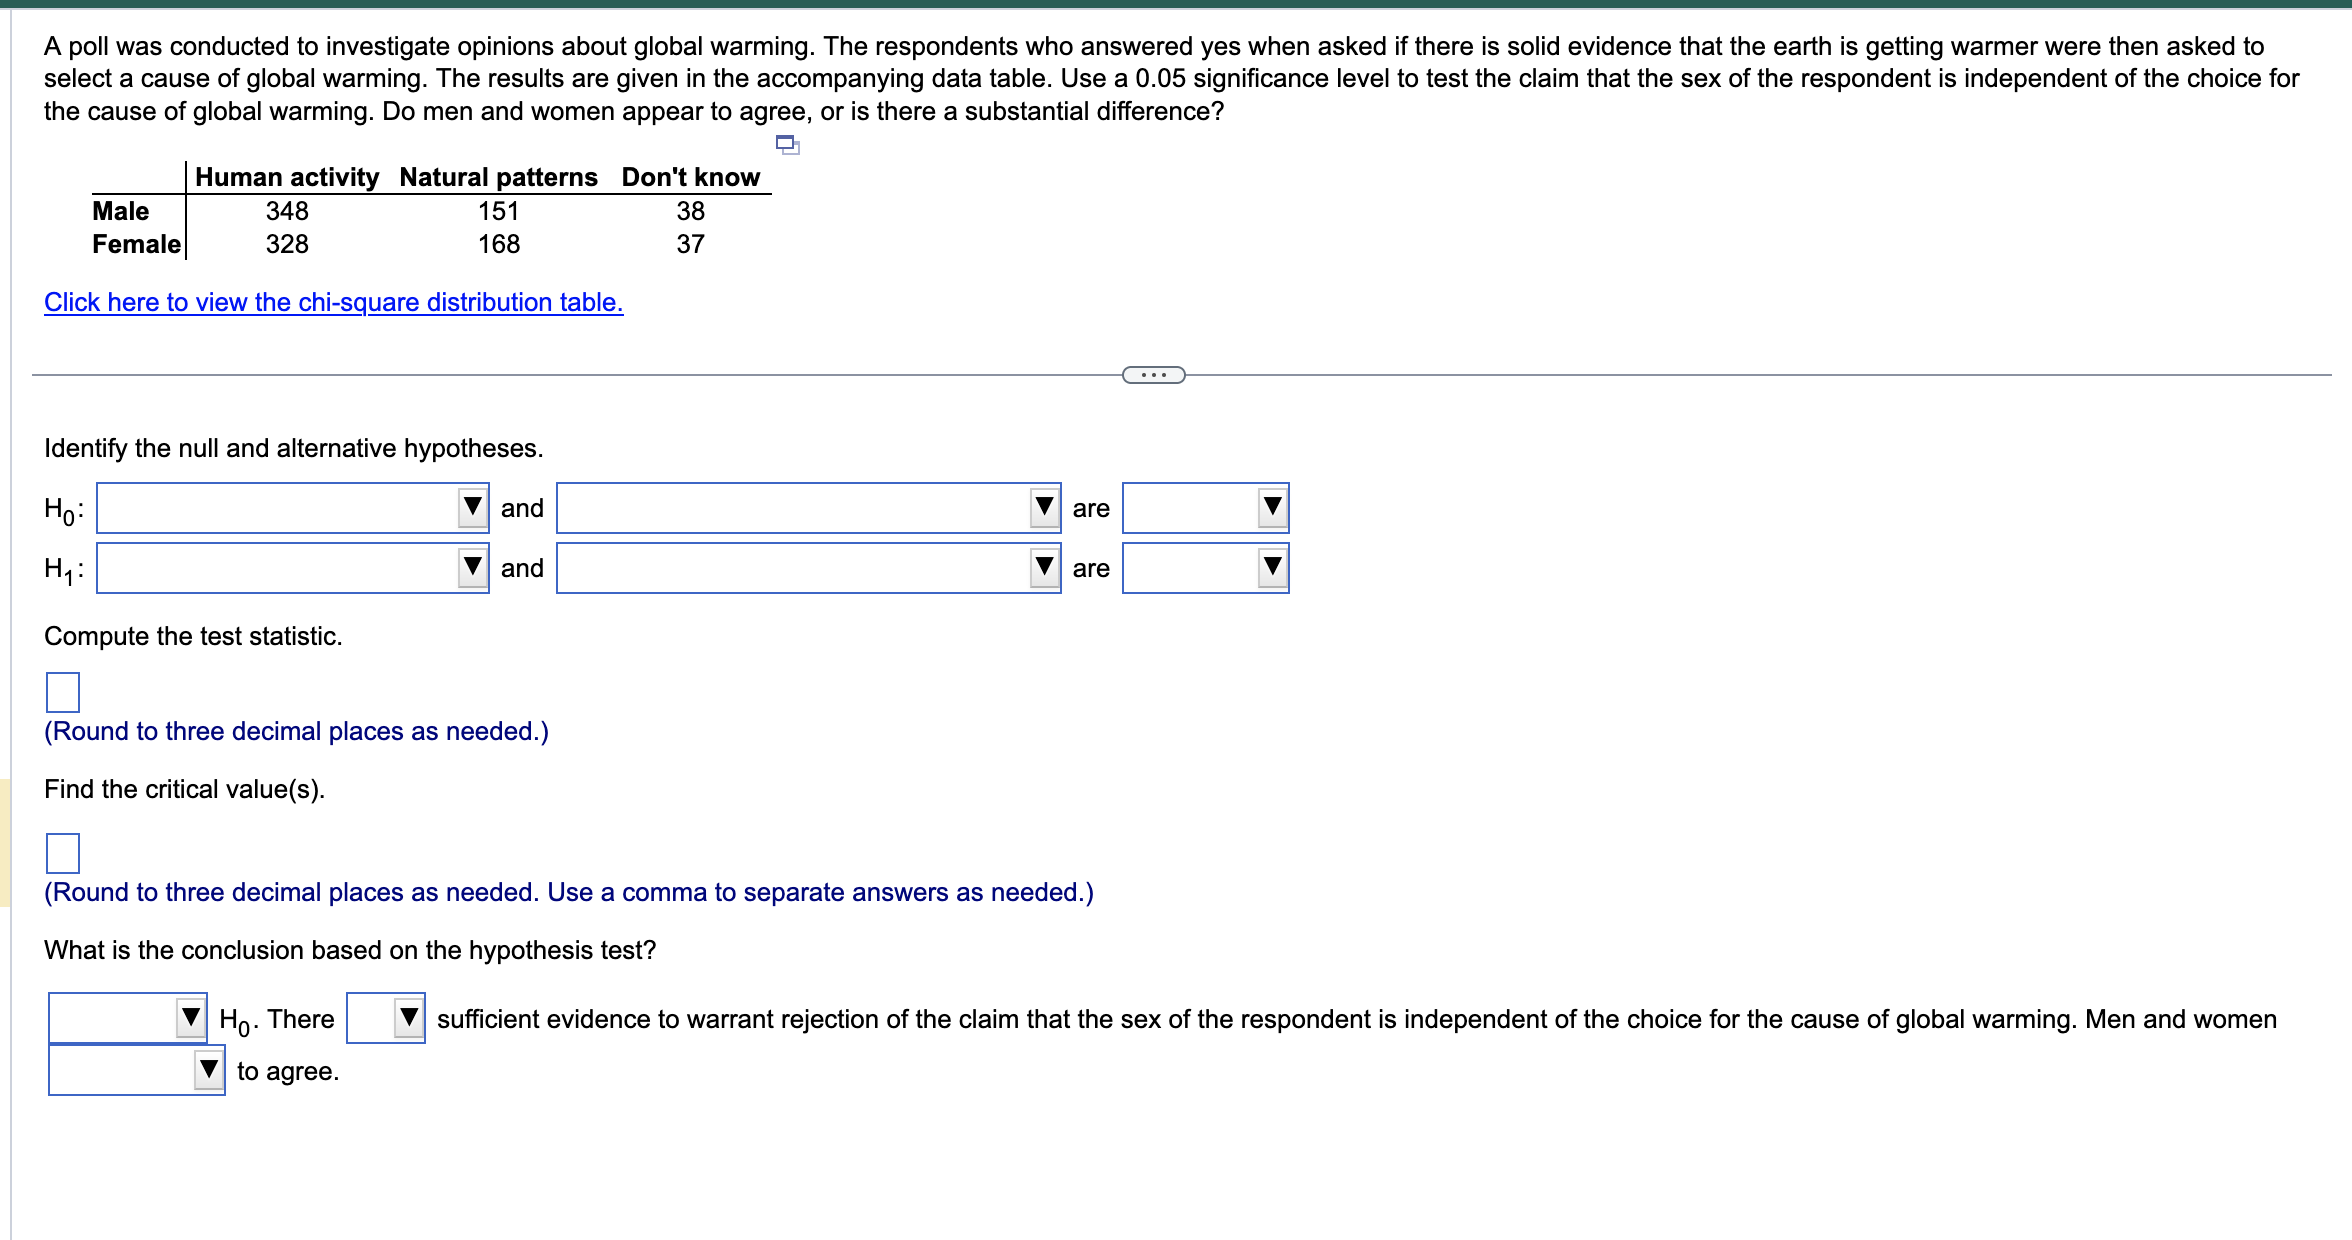
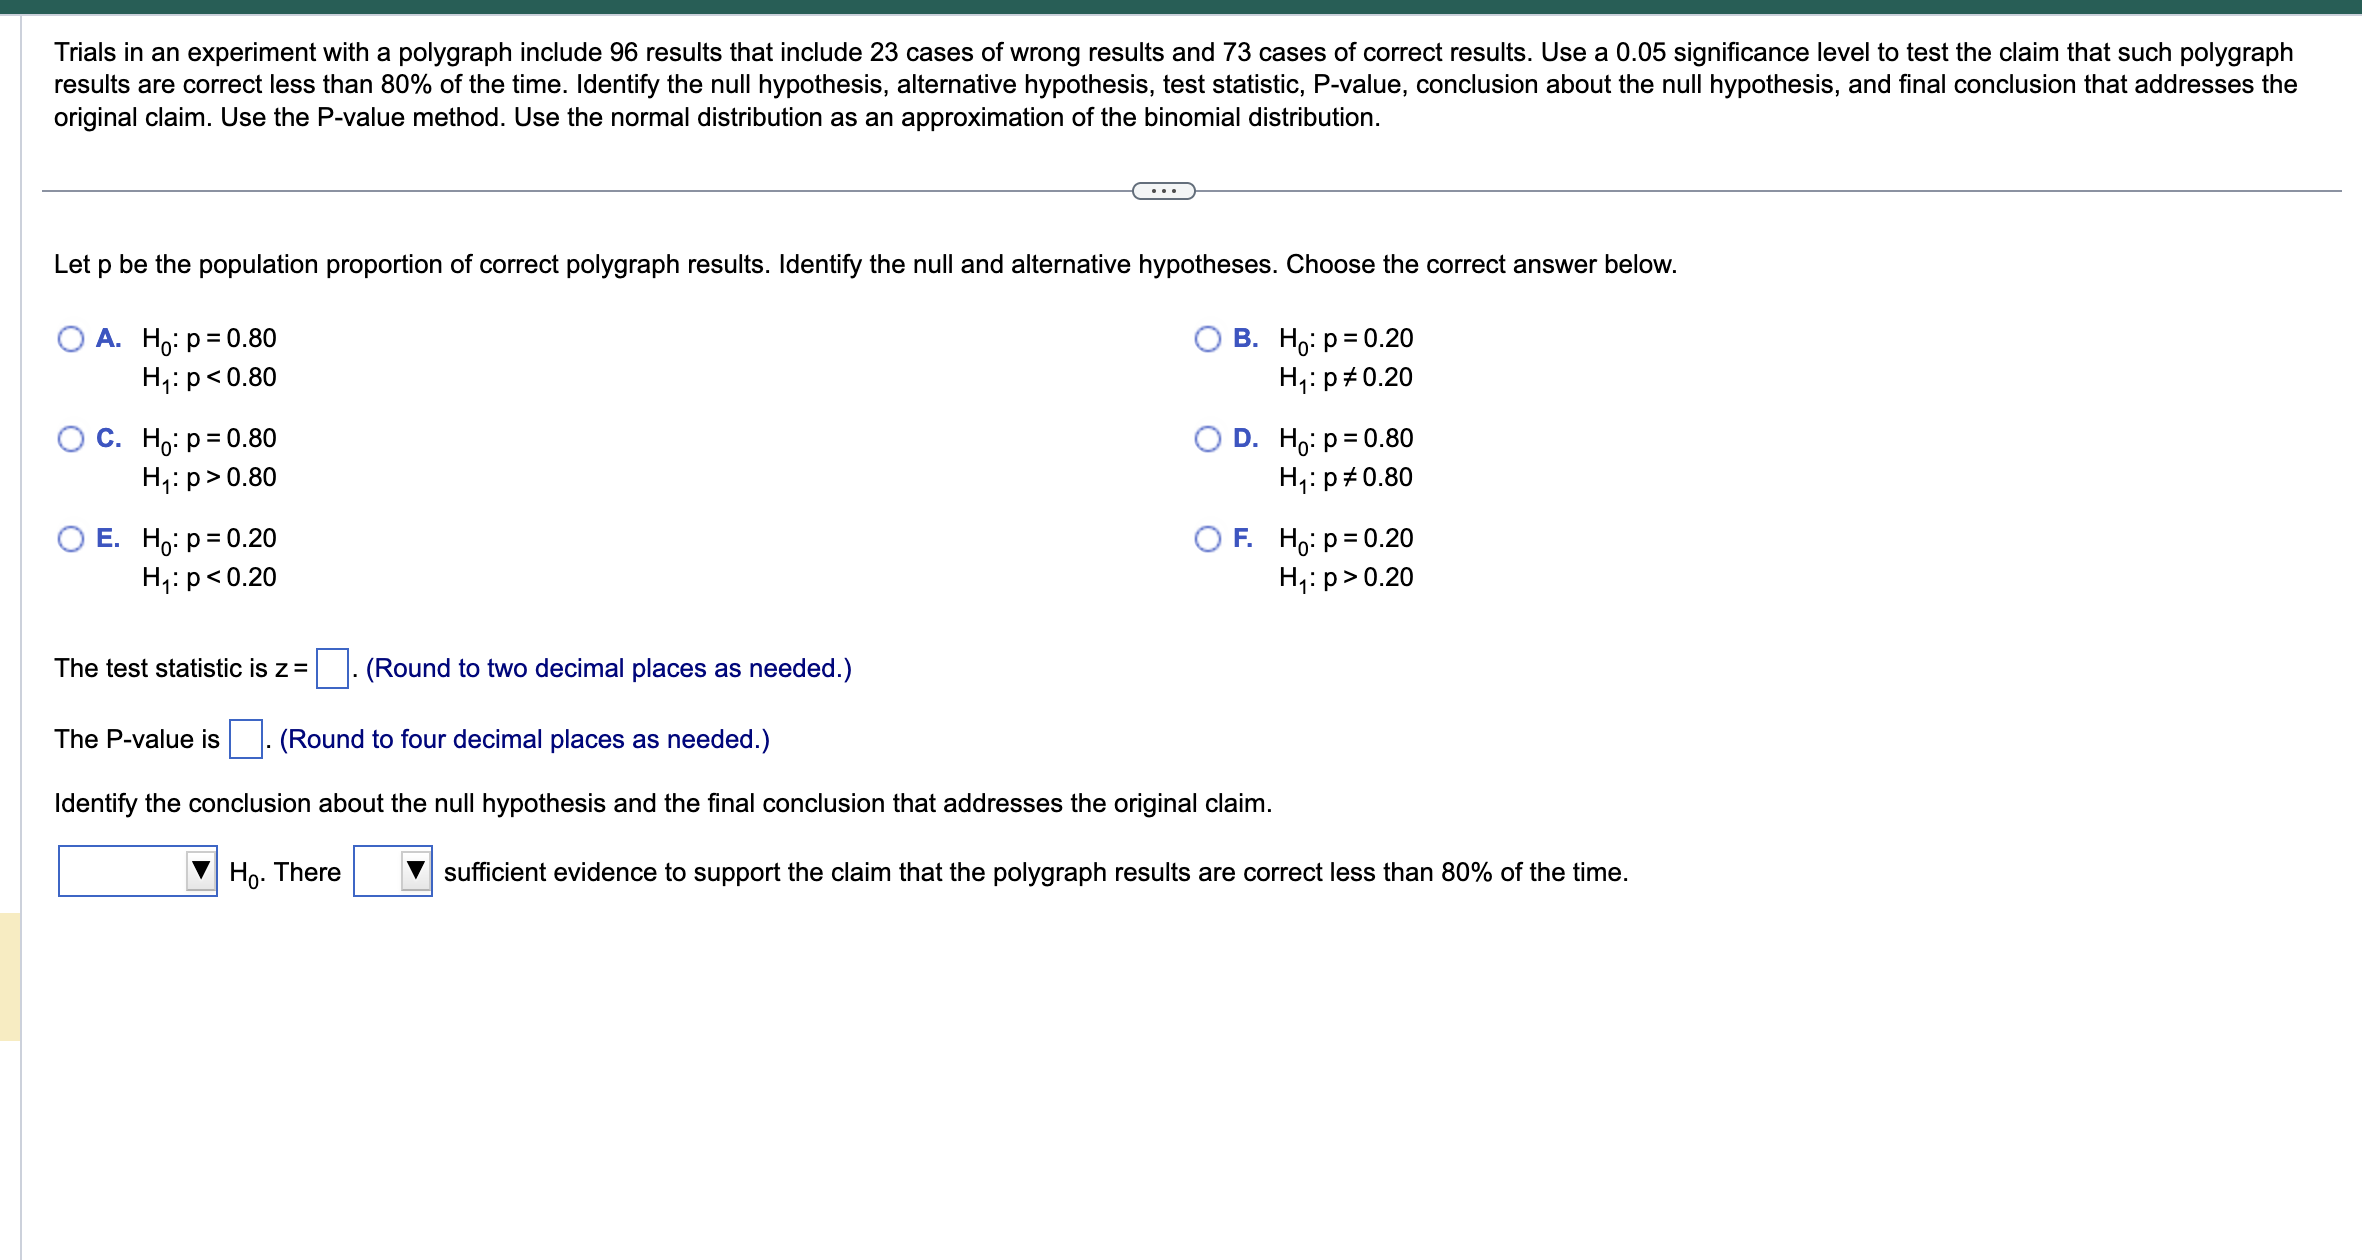
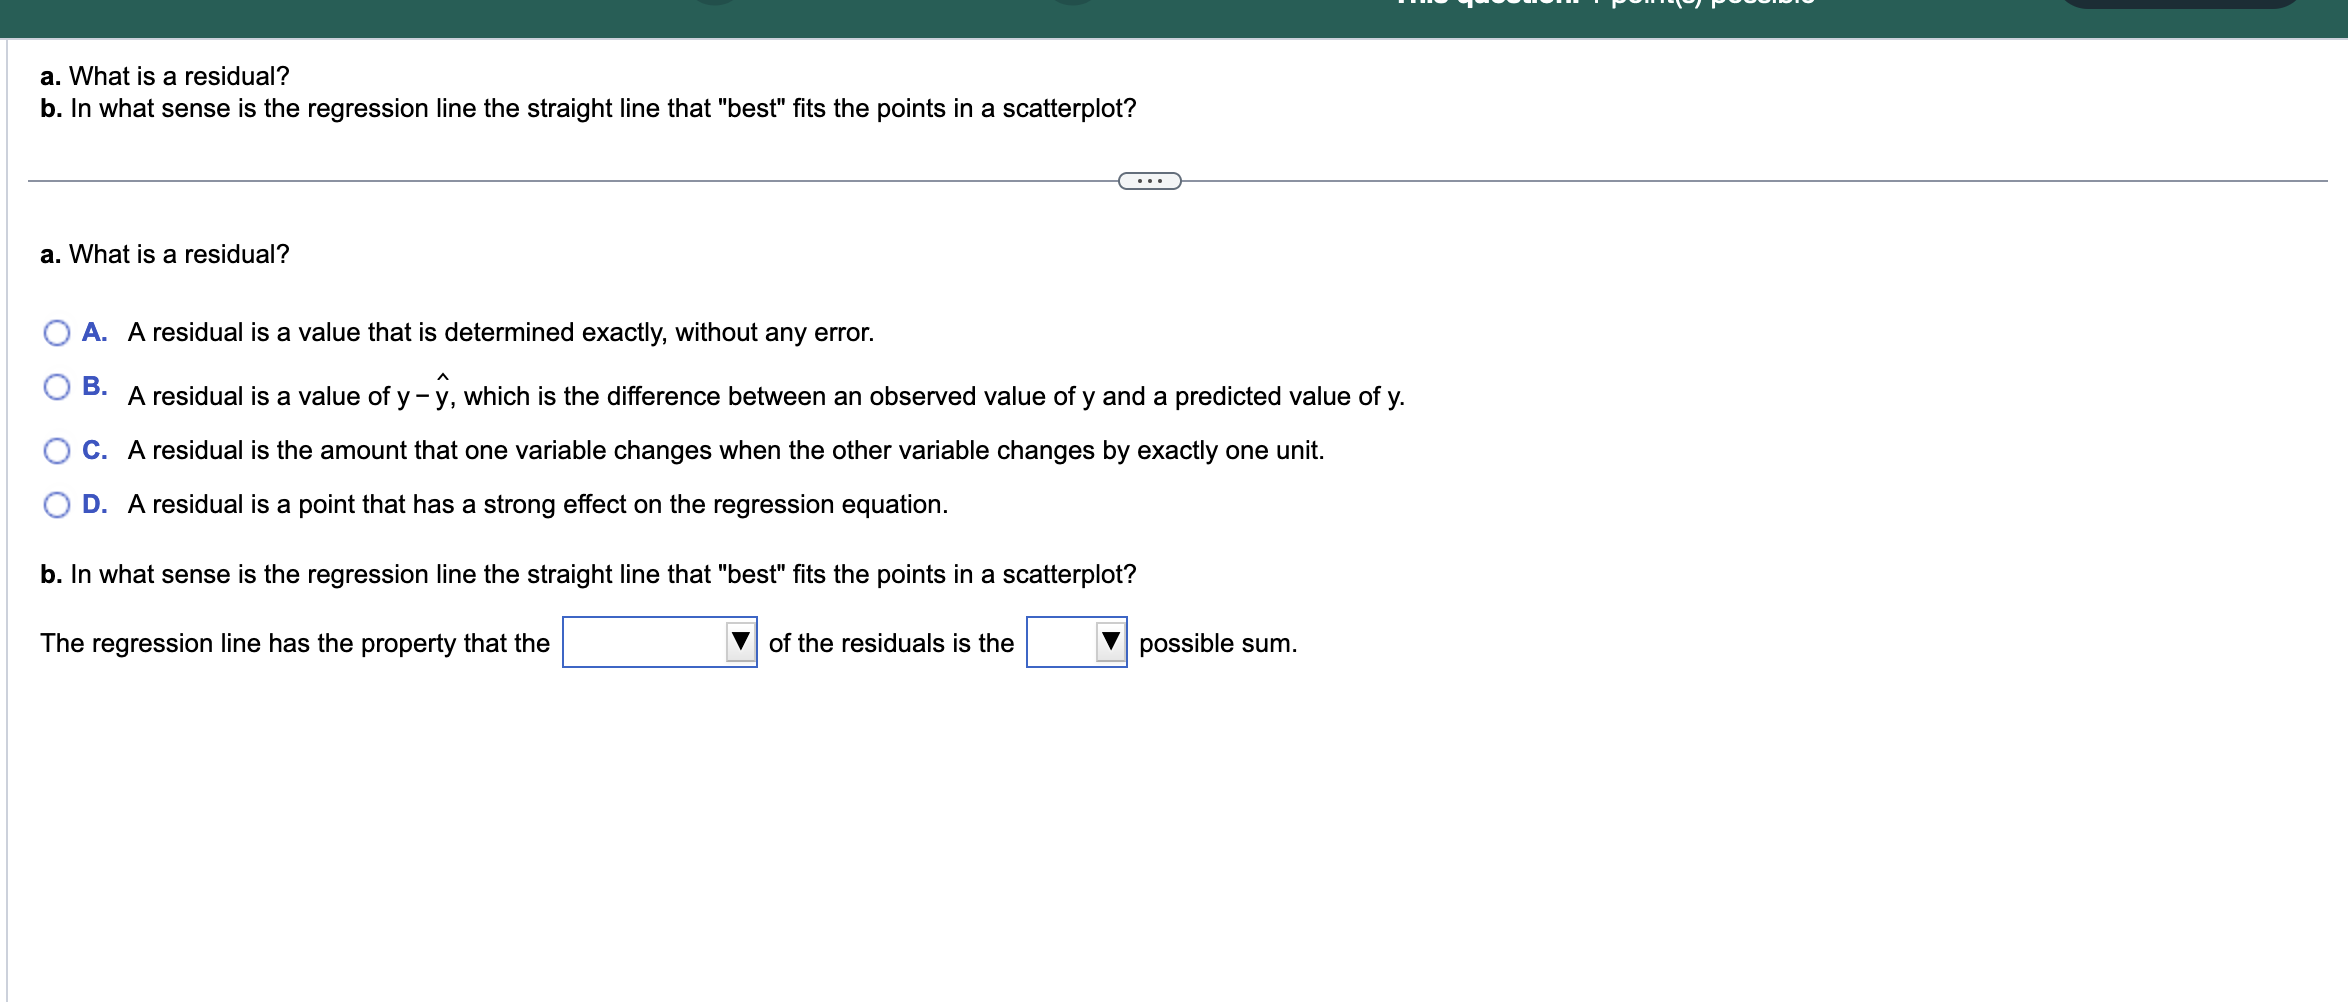
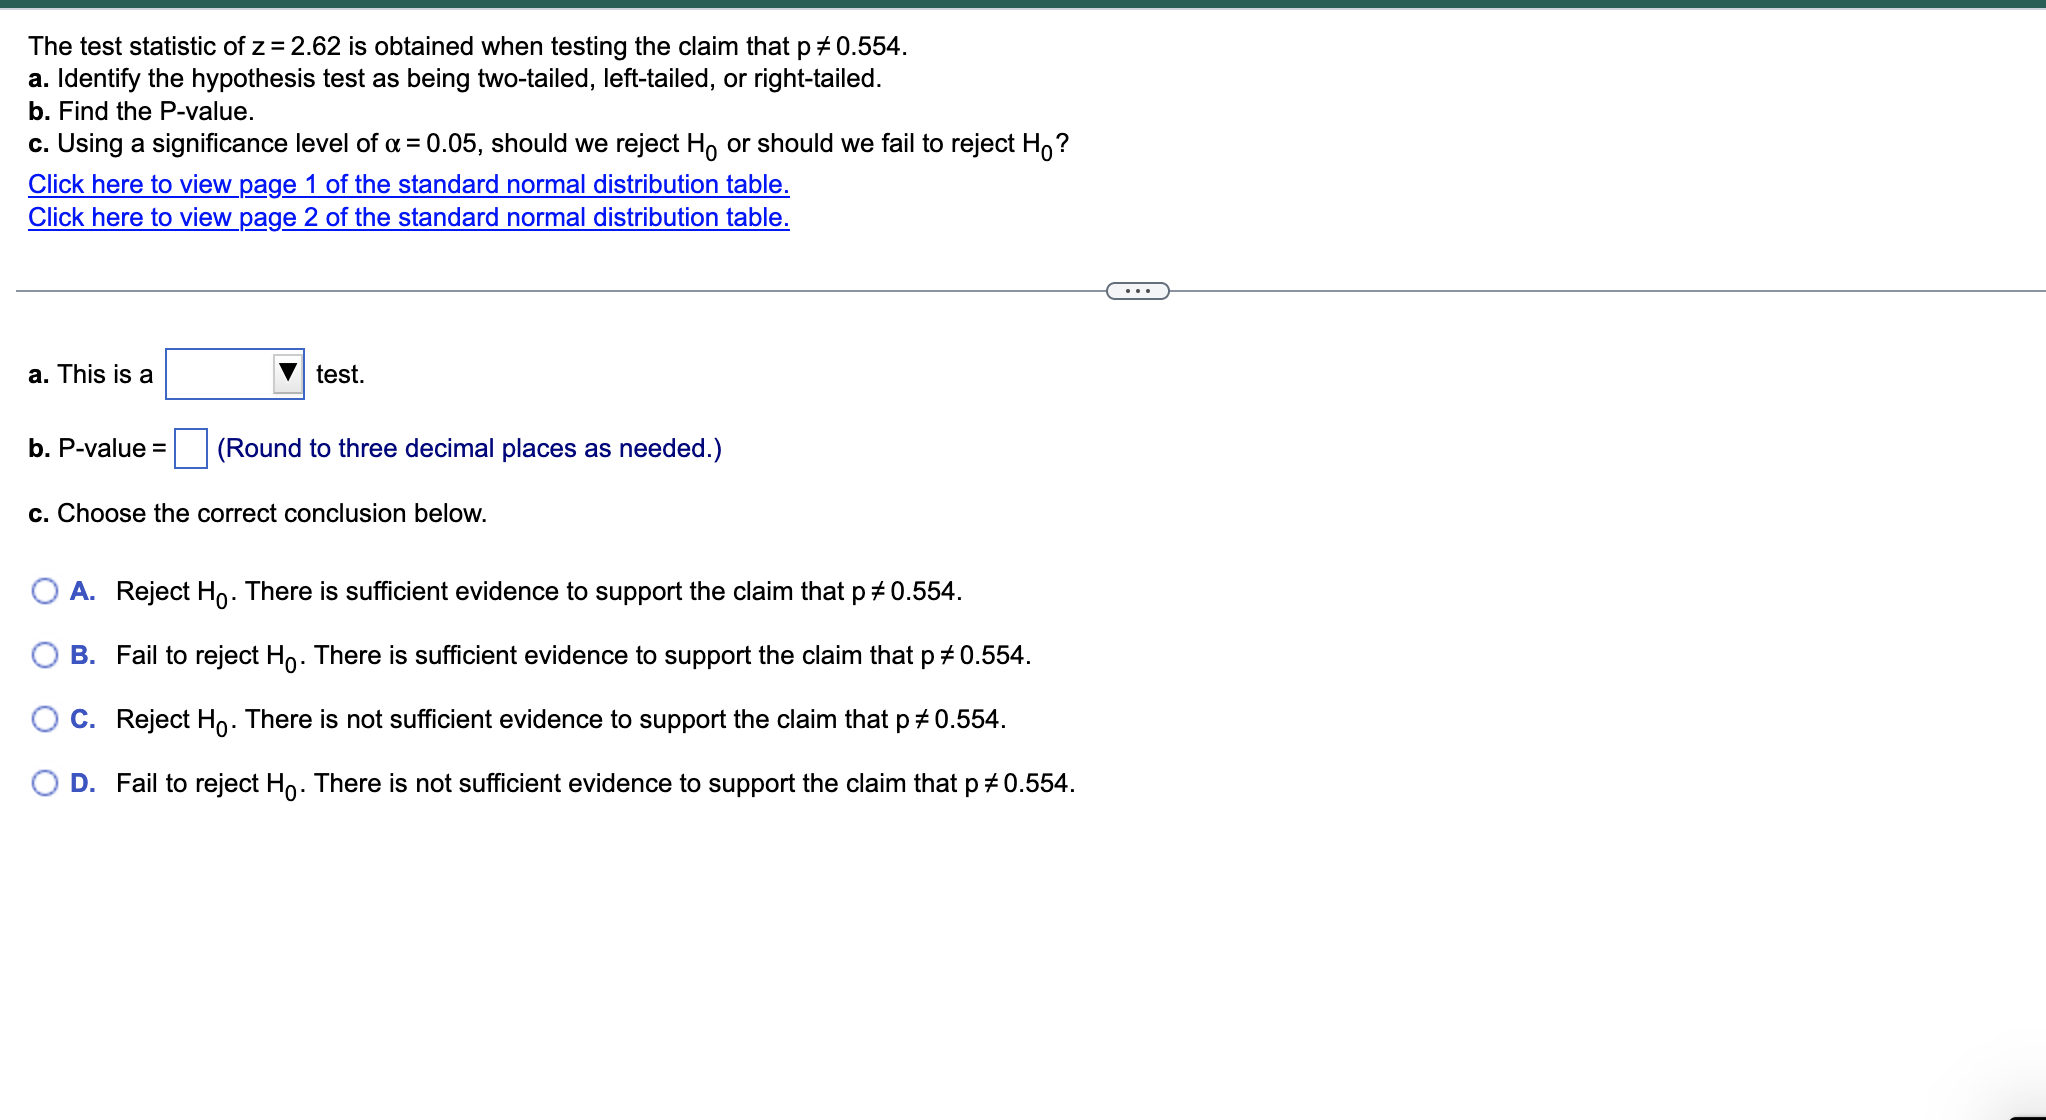
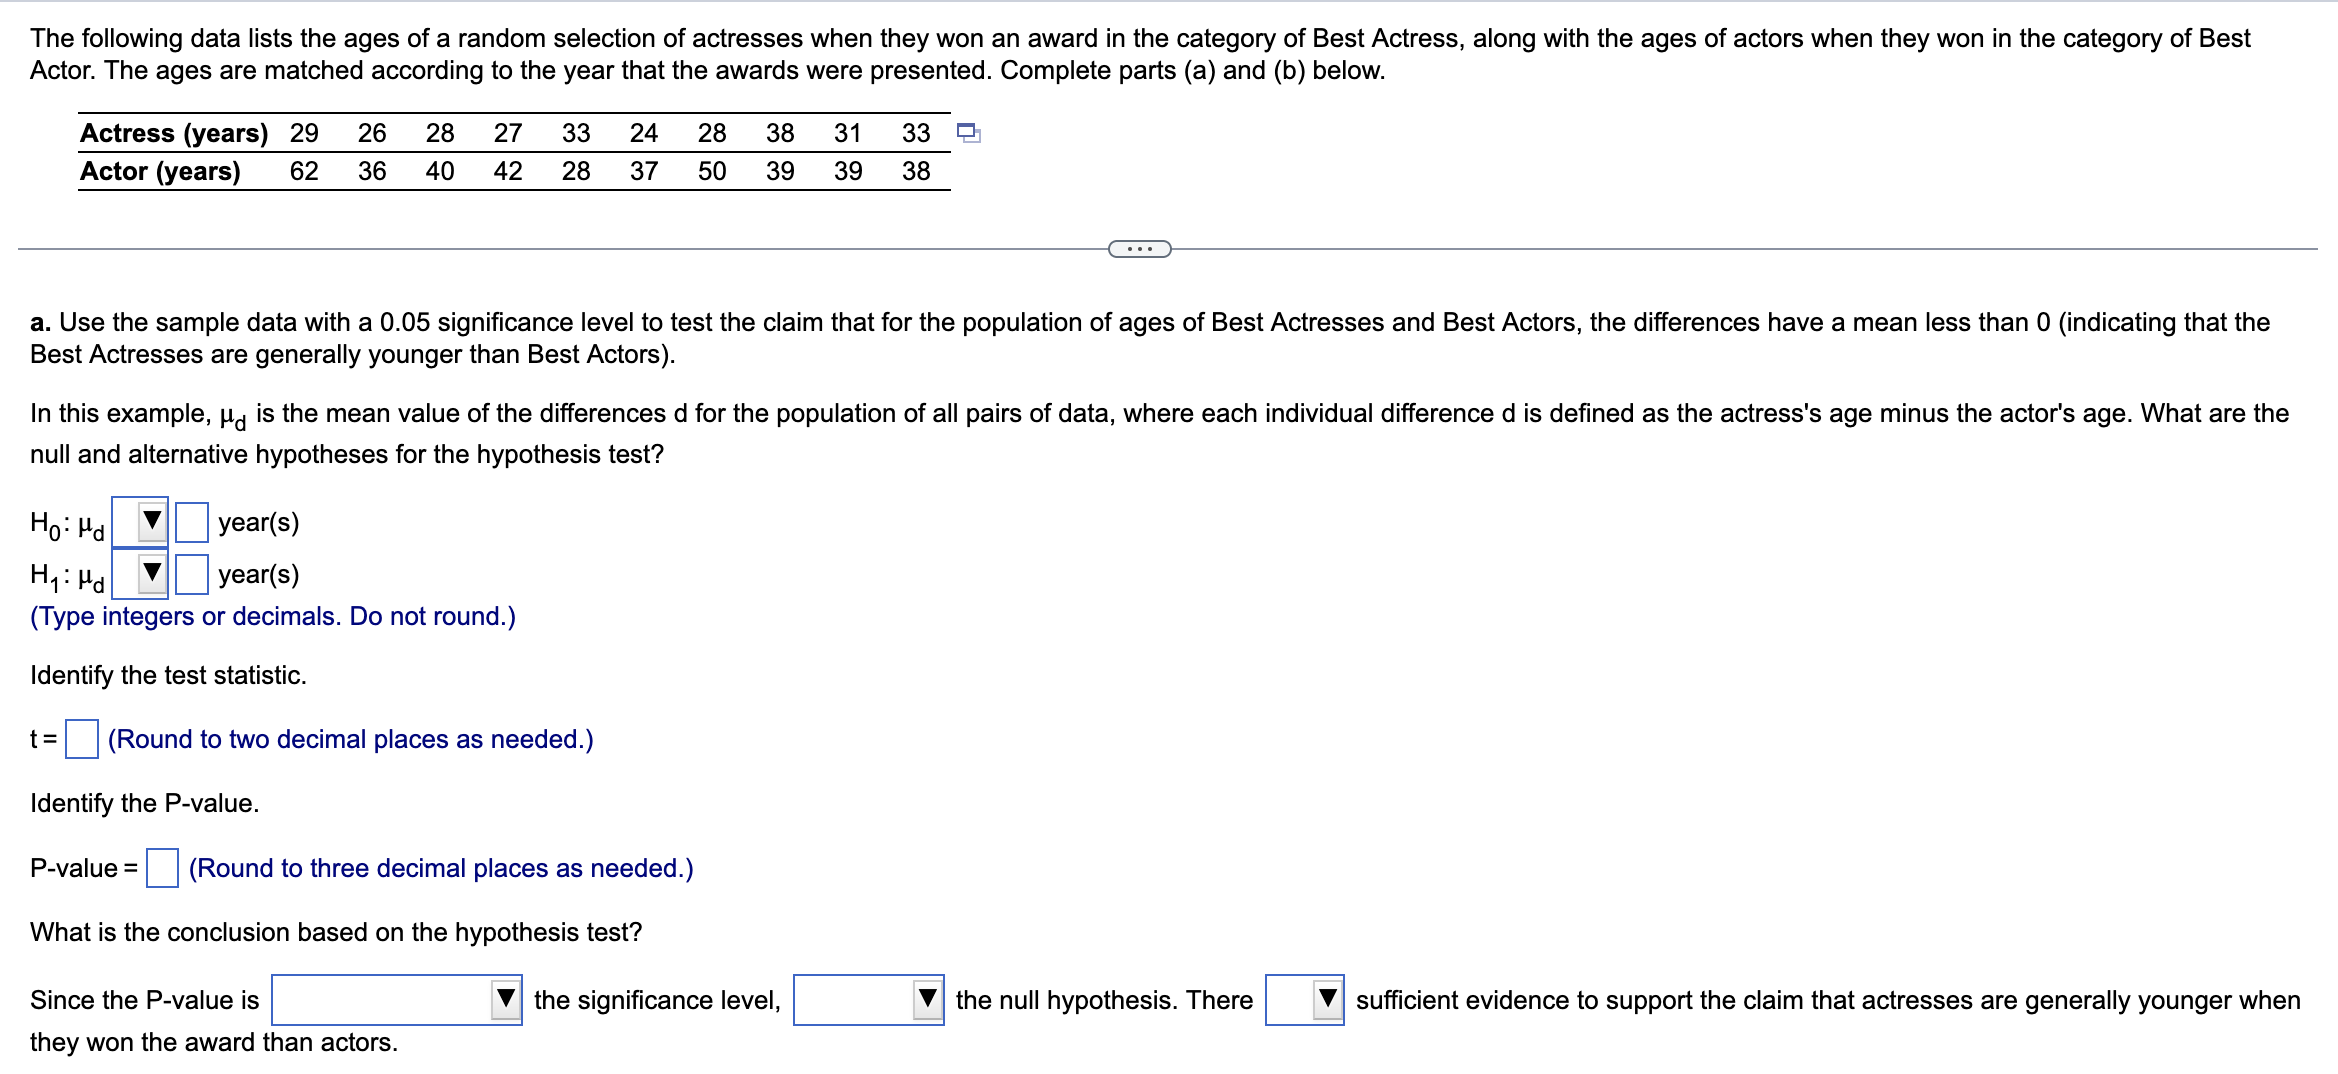
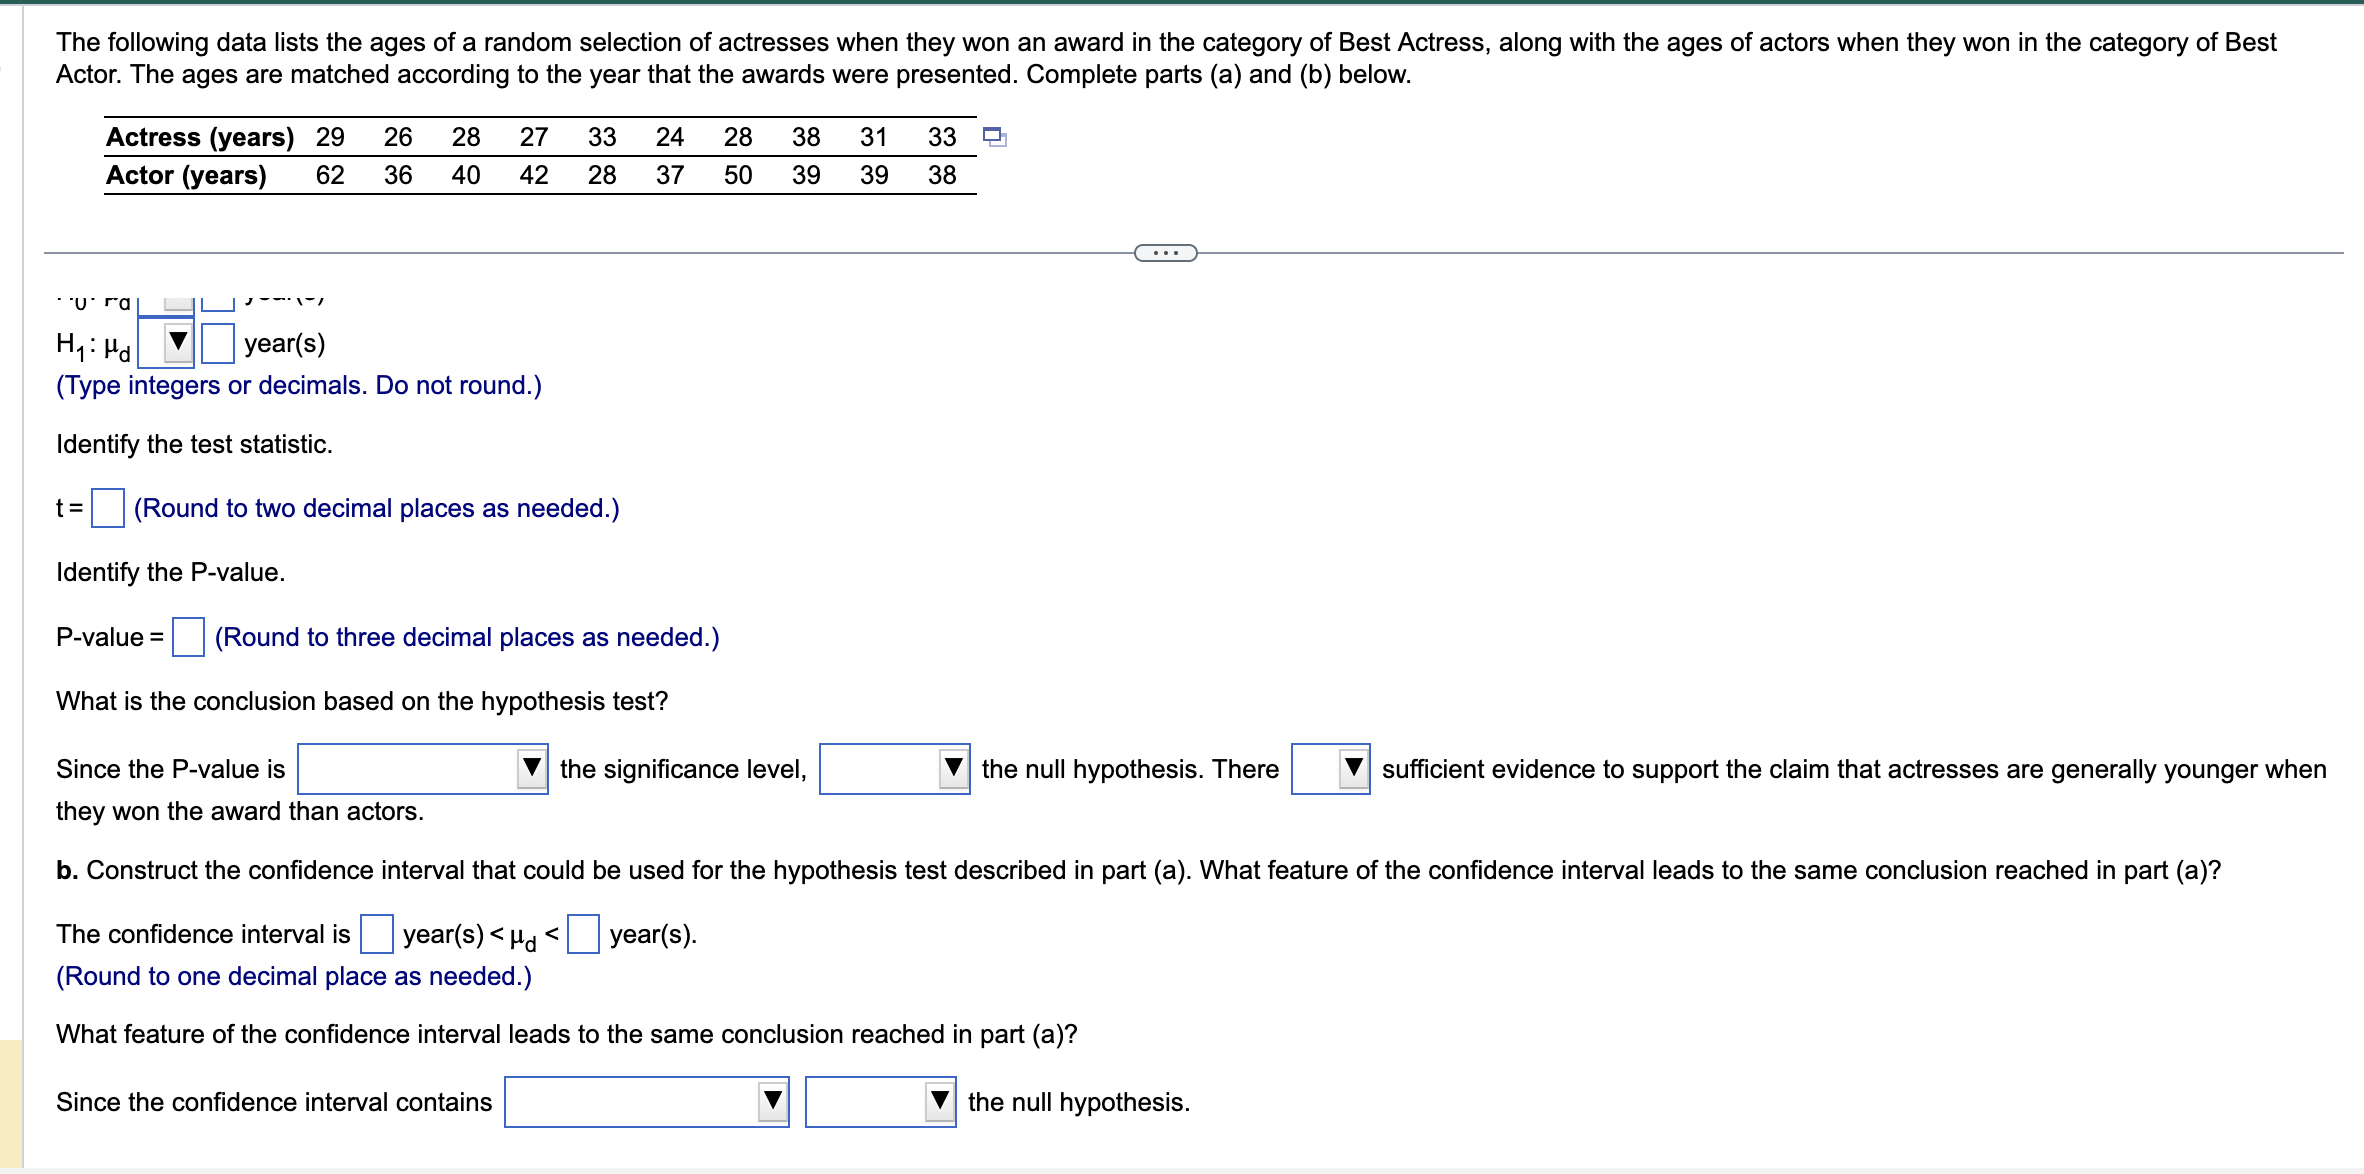
Fifty-four wild bears were anesthetized, and then their weights and chest sizes were measured and listed in a data set. Results are shown in the accompanying|Correlation Results display. Is there sufficient evidence to support the claim that there is a linear correlation between the weights of bears and their chest sizes? When measuring [gorrelation coeff, r: |0.976667 an anesthetized bear, is it easier to measure chest size than weight? If so, does it appear that a measured chest size can be used to predict the weight? Use a significance level of o= 0.05. Critical r: +0.2680855 P-value (two tailed): |0.000 Determine the null and alternative hypotheses. Ho:p| Hypl (Type integers or decimals. Do not round.) Identify the correlation coefficient, r. r= (Round to three decimal places as needed.) Identify the critical value(s). (Round to three decimal places as needed.) O A. There are two critical values at r= + (O B. There is one critical value at r= 1 Fifty-four wild bears were anesthetized, and then their weights and chest sizes were measured and listed in a data set. Results are shown in the accompanying|Correlation Results display. Is there sufficient evidence to support the claim that there is a linear correlation between the weights of bears and their chest sizes? When measuring (gorrelation coeff, r: |0.976667 an anesthetized bear, is it easier to measure chest size than weight? If so, does it appear that a measured chest size can be used to predict the weight? Use a Critical 02680855 ritical r: +0. significance level of a=0.05. P-value (two tailed):|0.000 Is there sufficient evidence to support the claim that there is a linear correlation between the weights of bears and their chest sizes? Choose the correct answer below and, if necessary, fill in the answer box within your choice. (Round to three decimal places as needed.) O A No, because the correlation coefficient falls outside the critical value(s). OB. Yes, because the correlation coefficient falls between the critical values. oc. No, because the correlation coefficient falls between the critical values. O D. Yes, because the correlation coefficient falls outside the critical value(s). () E. The answer cannot be determined from the given information. When measuring an anesthetized bear, is it easier to measure chest size than weight? If so, does it appear that a measured chest size can be used to predict the weight? (O A. Yes, itis easier to measure a chest size than a weight because measuring weight would require lifting the bear onto the scale. The chest size could not be used to predict weight because there is too much variance in the weight of the bears. . No, it is easier to measure weight than chest size because the chest is not a flat surface. . Yes, it is easier to measure a chest size than a weight because measuring weight would require lifting the bear onto the scale. The chest size could not be used to predict weight because there is not a linear correlation between the two. (O D. Yes, itis easier to measure a chest size than a weight because measuring weight would require lifting the bear onto the scale. The chest size could be used to predict weight because there is a linear correlation between the two. Use the value of the linear correlation coefficient r to find the coefficient of determination and the percentage of the total variation that can be explained by the linear relationship between the two variables. r=0.995 What is the value of the coefficient of determination? = (Round to four decimal places as needed.) What is the percentage of the total variation that can be explained by the linear relationship between the two variables? Explained variation=| |% (Round to two decimal places as needed.) A data set about speed dating includes "like" ratings of male dates made by the female dates. The summary statistics are n = 183, x = 6.56, s = 1.95. Use a 0. 10 significance level to test the claim that the population mean of such ratings is less than 7.00. Assume that a simple random sample has been selected. Identify the null and alternative hypotheses, test statistic, P-value, and state the final conclusion that addresses the original claim. . . . What are the null and alternative hypotheses? O A. Ho: H= 7.00 OB. Ho: H = 7.00 Hy : H # 7.00 H1: H> 7.00 O C. Ho: H 7.00 Hy: H p; Hytig g Hytig 0.80 H,: p # 0.80 O E. Ho: p = 0.20 OF. Ho: P = 0.20 H, : p 0.20 The test statistic is z= ]. (Round to two decimal places as needed.) The P-value is . (Round to four decimal places as needed.) Identify the conclusion about the null hypothesis and the final conclusion that addresses the original claim. Ho. There sufficient evidence to support the claim that the polygraph results are correct less than 80% of the time.a. What is a residual? b. In what sense is the regression line the straight line that "best" fits the points in a scatterplot? a. What is a residual? A. A residual is a value that is determined exactly, without any error. O B. A residual is a value of y - y, which is the difference between an observed value of y and a predicted value of y. O C. A residual is the amount that one variable changes when the other variable changes by exactly one unit. O D. A residual is a point that has a strong effect on the regression equation. b. In what sense is the regression line the straight line that "best" fits the points in a scatterplot? The regression line has the property that the of the residuals is the possible sum.The test statistic of z = 2.62 is obtained when testing the claim that p # 0.554. a. Identify the hypothesis test as being two-tailed, left-tailed, or right-tailed b. Find the P-value c. Using a significance level of a = 0.05, should we reject Ho or should we fail to reject Ho ? Click here to view page 1 of the standard normal distribution table. Click here to view page 2 of the standard normal distribution table. . . . a. This is a test. b. P-value = (Round to three decimal places as needed.) c. Choose the correct conclusion below. O A. Reject Ho. There is sufficient evidence to support the claim that p # 0.554. O B. Fail to reject Ho. There is sufficient evidence to support the claim that p # 0.554. O C. Reject Ho. There is not sufficient evidence to support the claim that p # 0.554. O D. Fail to reject Ho. There is not sufficient evidence to support the claim that p # 0.554.The following data lists the ages of a random selection of actresses when they won an award in the category of Best Actress, along with the ages of actors when they won in the category of Best Actor. The ages are matched according to the year that the awards were presented. Complete parts (a) and (b) below. Actress (years) 29 26 28 27 33 24 28 38 31 33 O Actor (years) 62 36 40 42 28 37 50 39 39 38 a. Use the sample data with a 0.05 significance level to test the claim that for the population of ages of Best Actresses and Best Actors, the differences have a mean less than 0 (indicating that the Best Actresses are generally younger than Best Actors). In this example, p is the mean value of the differences d for the population of all pairs of data, where each individual difference d is defined as the actress's age minus the actor's age. What are the null and alternative hypotheses for the hypothesis test? Hoikg| Y year(s) Hytpgl year(s) (Type integers or decimals. Do not round.) Identify the test statistic. t= (Round to two decimal places as needed.) Identify the P-value. P-value = (Round to three decimal places as needed.) What is the conclusion based on the hypothesis test? Since the P-value is V| the significance level, V| the null hypothesis. There V| sufficient evidence to support the claim that actresses are generally younger when they won the award than actors. The following data lists the ages of a random selection of actresses when they won an award in the category of Best Actress, along with the ages of actors when they won in the category of Best Actor. The ages are matched according to the year that the awards were presented. Complete parts (a) and (b) below. Actress (years) 29 26 28 27 33 24 28 38 31 33 O Actor (years) 62 36 40 42 28 37 50 39 39 38 Syt ra L a===s Hy: pdE| year(s) (Type integers or decimals. Do not round.) Identify the test statistic. t= (Round to two decimal places as needed.) Identify the P-value. P-value = (Round to three decimal places as needed.) What is the conclusion based on the hypothesis test? Since the P-value is V| the significance level, V| the null hypothesis. There V| sufficient evidence to support the claim that actresses are generally younger when they won the award than actors. b. Construct the confidence interval that could be used for the hypothesis test described in part (a). What feature of the confidence interval leads to the same conclusion reached in part (a)? The confidence interval is year(s)
Step by Step Solution
There are 3 Steps involved in it
Step: 1
Get Instant Access to Expert-Tailored Solutions
See step-by-step solutions with expert insights and AI powered tools for academic success
Step: 2
Step: 3
Ace Your Homework with AI
Get the answers you need in no time with our AI-driven, step-by-step assistance