

Answered step by step
Verified Expert Solution
Question
1 Approved Answer
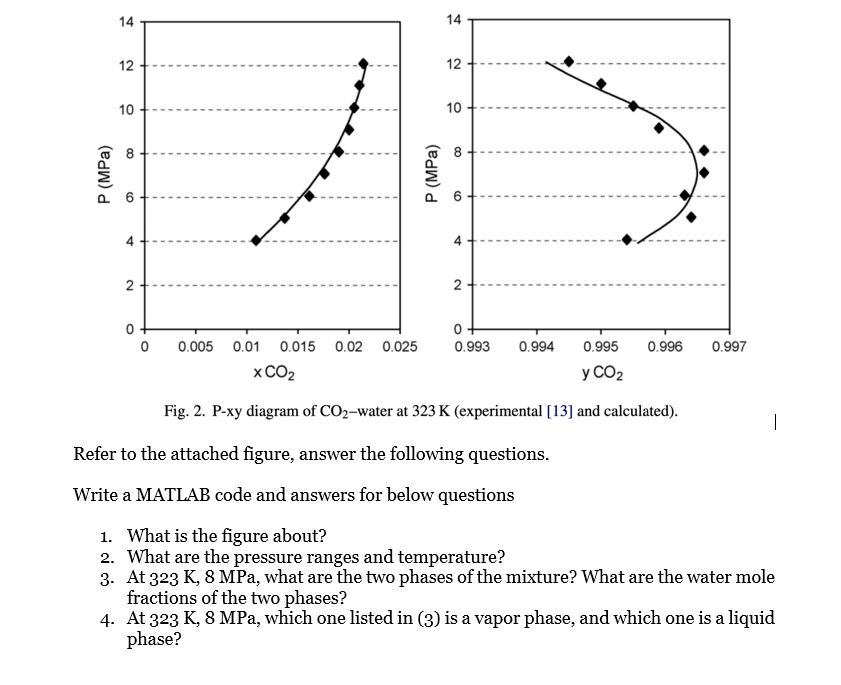
Fig. 2 . P - xy diagram of C O 2 - water at 3 2 3 K ( experimental [ 1 3 ] and
Fig. Pxy diagram of water at experimental and calculated
Refer to the attached figure, answer the following questions.
Write a MATLAB code and answers for below questions
What is the figure about?
What are the pressure ranges and temperature?
At MPa, what are the two phases of the mixture? What are the water mole
fractions of the two phases?
At MPa, which one listed in is a vapor phase, and which one is a liquid
phase?
Step by Step Solution
There are 3 Steps involved in it
Step: 1

Get Instant Access to Expert-Tailored Solutions
See step-by-step solutions with expert insights and AI powered tools for academic success
Step: 2

Step: 3
Ace Your Homework with AI
Get the answers you need in no time with our AI-driven, step-by-step assistance
Get Started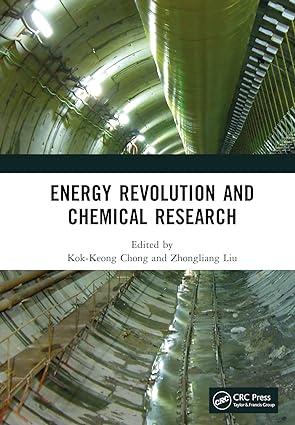
Energy Revolution And Chemical Research
Authors: Kok-Keong Chong, Zhongliang Liu
1st Edition
1032365544, 978-1032365541