

Answered step by step
Verified Expert Solution
Question
1 Approved Answer
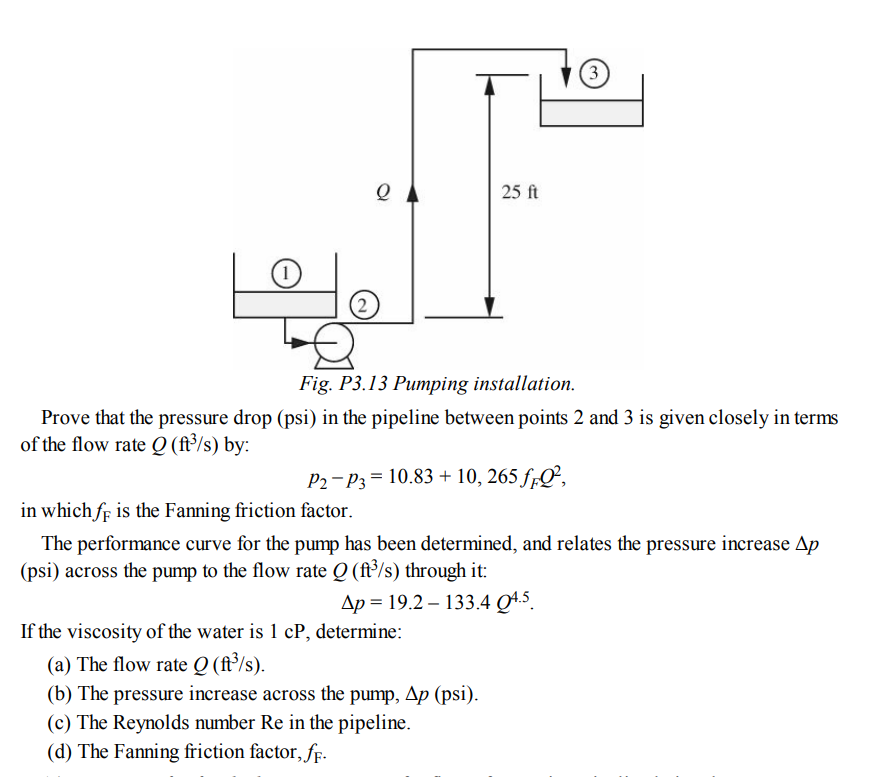
Fig. P 3 . 1 3 Pumping installation. Prove that the pressure drop ( psi ) in the pipeline between points 2 and 3 is
Fig. P Pumping installation.
Prove that the pressure drop psi in the pipeline between points and is given closely in terms
of the flow rate by:
in which is the Fanning friction factor.
The performance curve for the pump has been determined, and relates the pressure increase
psi across the pump to the flow rate through it:
If the viscosity of the water is determine:
a The flow rate
b The pressure increase across the pump, psi
c The Reynolds number Re in the pipeline.
d The Fanning friction factor,
Step by Step Solution
There are 3 Steps involved in it
Step: 1

Get Instant Access to Expert-Tailored Solutions
See step-by-step solutions with expert insights and AI powered tools for academic success
Step: 2

Step: 3
Ace Your Homework with AI
Get the answers you need in no time with our AI-driven, step-by-step assistance
Get Started
Fundamentals of Thermal-Fluid Sciences
Authors: Yunus A. Cengel, Robert H. Turner, John M. Cimbala
5th edition
78027680, 78027683, 9781760421359, 978-0078027680