Question
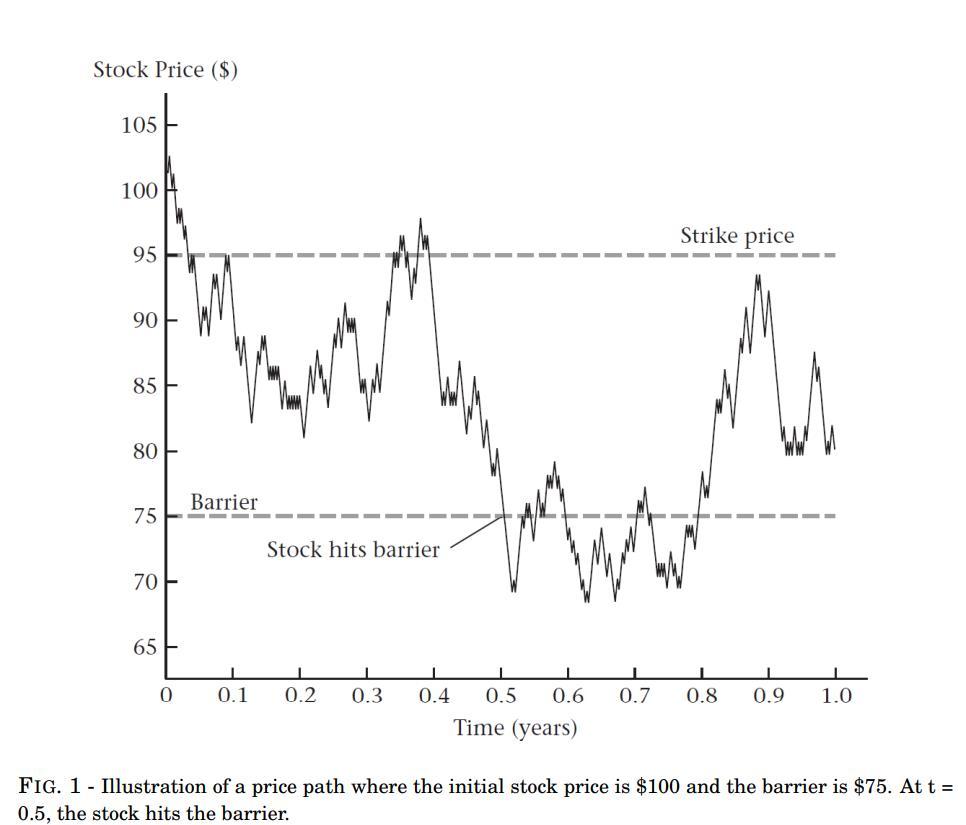
Figure 1 illustrates how a barrier option works. The stock price starts at $100, ends at $80, and hits the barrier of $75 about halfway
Figure 1 illustrates how a barrier option works. The stock price starts at $100, ends at $80, and hits the barrier of $75 about halfway through the year. If the option were a 95-strike down-and-in put, the option would knock in and pay $15 (= max(0, $95$80)) at expiration. If the option were a down-and-out put, it would be worthless at expiration because the barrier was hit. If the option were a down-and-in call, it would knock in at $75 but still be worthless at expiration because the stock price is below the strike price. Now we value a down-and-out put option with European style using Monte Carlo simulations. Assume that stock prices are lognormally distributed. Stock price today is $100. Annual continuously compounded risk-free rate is r = 0.06, annual volatility of return = 0.30. Strike price K = $95. The barrier is $75. This barrier option expires in 1 year. We split the time till maturity date into 5 intervals and simulate stock prices at the end of each interval. We only consider whether the barrier is hit or not based on these 5 stock prices.
Compute the Monte Carlo price of this barrier option based on 4 simulations

Step by Step Solution
There are 3 Steps involved in it
Step: 1

Get Instant Access to Expert-Tailored Solutions
See step-by-step solutions with expert insights and AI powered tools for academic success
Step: 2

Step: 3

Ace Your Homework with AI
Get the answers you need in no time with our AI-driven, step-by-step assistance
Get Started


