Answered step by step
Verified Expert Solution
Question
1 Approved Answer
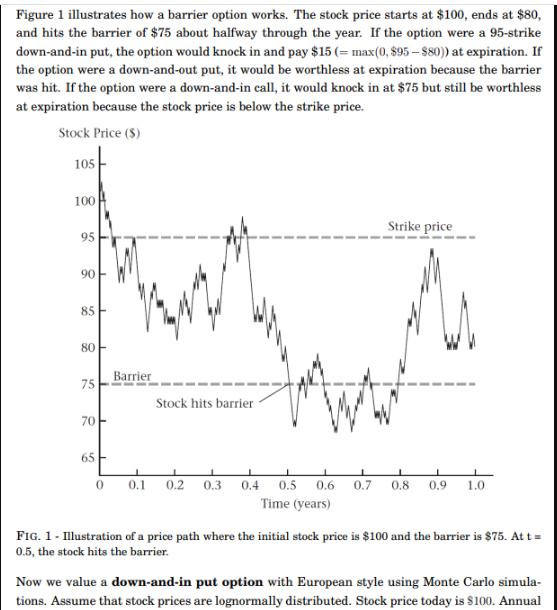
Figure 1 illustrates how a barrier option works. The stock price starts at $100, ends at $80, and hits the barrier of $75 about


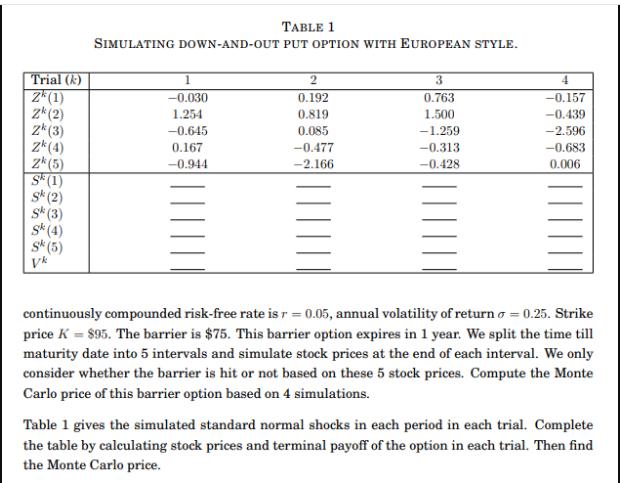
Figure 1 illustrates how a barrier option works. The stock price starts at $100, ends at $80, and hits the barrier of $75 about halfway through the year. If the option were a 95-strike down-and-in put, the option would knock in and pay $15 (= max(0, 895-880)) at expiration. If the option were a down-and-out put, it would be worthless at expiration because the barrier was hit. If the option were a down-and-in call, it would knock in at $75 but still be worthless at expiration because the stock price is below the strike price. Stock Price ($) 105 100 95 90 85 80 75 70 65- 0 Barrier Stock hits barrier 0.1 0.2 0.3 0.4 0.5 0.6 0.7 Time (years) Strike price 0.8 0.9 1.0 FIG. 1 - Illustration of a price path where the initial stock price is $100 and the barrier is $75. At t = 0.5, the stock hits the barrier. Now we value a down-and-in put option with European style using Monte Carlo simula- tions. Assume that stock prices are lognormally distributed. Stock price today is $100. Annual Trial (k) 2 (1) Zk (2) Zk (3) Zk (4) Zk (5) S (1) Sk (2) Sk (3) Sk (4) Sk (5) TABLE 1 SIMULATING DOWN-AND-OUT PUT OPTION WITH EUROPEAN STYLE. 1 -0.030 1.254 -0.645 0.167 -0.944 2 0.192 0.819 0.085 -0.477 -2.166 3 0.763 1.500 -1.259 -0.313 -0.428 4 -0.157 -0.439 -2.596 -0.683 0.006 continuously compounded risk-free rate is r = 0.05, annual volatility of return o = 0.25. Strike price K = 895. The barrier is $75. This barrier option expires in 1 year. We split the time till maturity date into 5 intervals and simulate stock prices at the end of each interval. We only consider whether the barrier is hit or not based on these 5 stock prices. Compute the Monte Carlo price of this barrier option based on 4 simulations. Table 1 gives the simulated standard normal shocks in each period in each trial. Complete the table by calculating stock prices and terminal payoff of the option in each trial. Then find the Monte Carlo price.
Step by Step Solution
There are 3 Steps involved in it
Step: 1
Here are the stepbystep workings to value a downandin European put option using Monte Carlo simulati...
Get Instant Access to Expert-Tailored Solutions
See step-by-step solutions with expert insights and AI powered tools for academic success
Step: 2

Step: 3

Ace Your Homework with AI
Get the answers you need in no time with our AI-driven, step-by-step assistance
Get Started


