Answered step by step
Verified Expert Solution
Question
1 Approved Answer
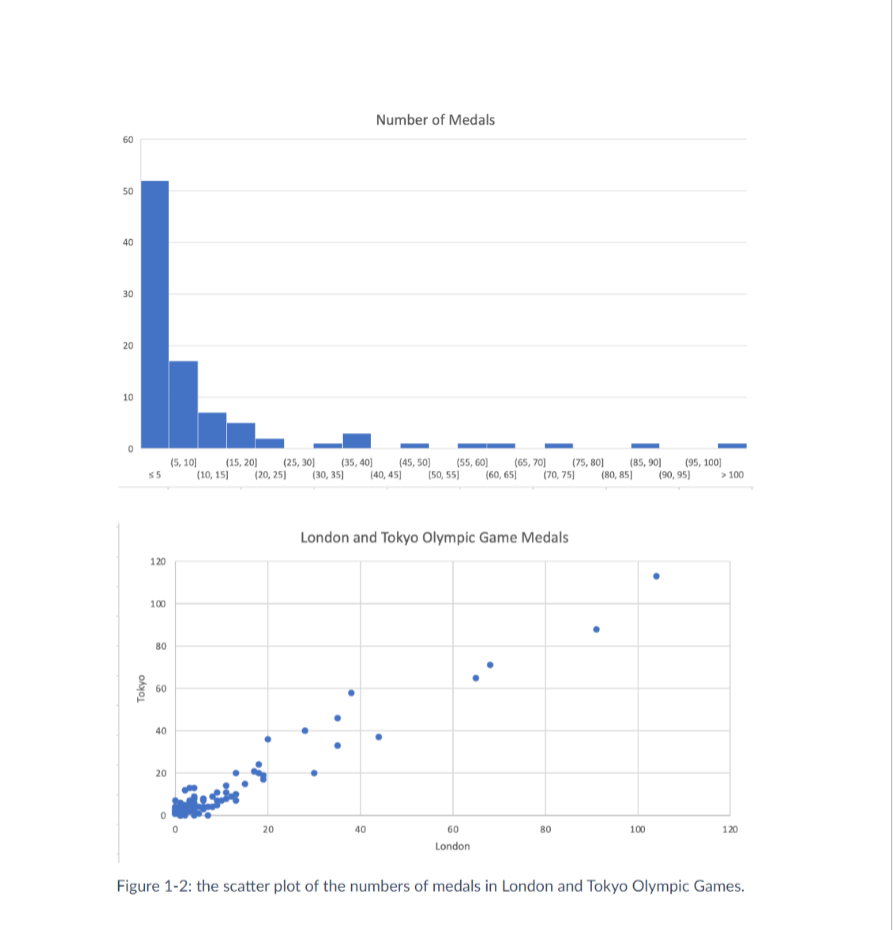
Figure 1-1 shows the histogram of the numbers of Olympic medals for the participating teams in Tokyo in 2021. Describe any statistical features of the
Figure 1-1 shows the histogram of the numbers of Olympic medals for the participating teams in Tokyo in 2021. Describe any statistical features of the data based on this histogram.
Figure 1-2 shows the scatter plot of the numbers of Olympic medals for the participating teams in London 2012 (x-axis) and Tokyo in 2021 (y-axis). Each dot represents one participating team.

Step by Step Solution
There are 3 Steps involved in it
Step: 1

Get Instant Access to Expert-Tailored Solutions
See step-by-step solutions with expert insights and AI powered tools for academic success
Step: 2

Step: 3

Ace Your Homework with AI
Get the answers you need in no time with our AI-driven, step-by-step assistance
Get Started


