

Answered step by step
Verified Expert Solution
Question
1 Approved Answer
FIGURE 11.8 Sampling Distribution for Example 11.2 p-value 11.27 Refer to Example 11.2. Create a table that shows the effect on the test statistic
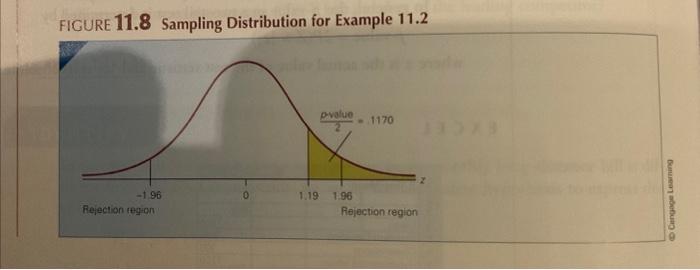
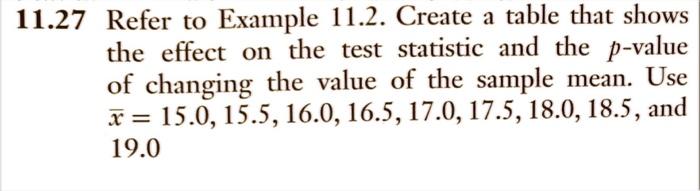
FIGURE 11.8 Sampling Distribution for Example 11.2 p-value 11.27 Refer to Example 11.2. Create a table that shows the effect on the test statistic and the p-value of changing the value of the sample mean. Use x= 15.0, 15.5, 16.0, 16.5, 17.0, 17.5, 18.0, 18.5, and 19.0
Step by Step Solution
There are 3 Steps involved in it
Step: 1

Get Instant Access to Expert-Tailored Solutions
See step-by-step solutions with expert insights and AI powered tools for academic success
Step: 2

Step: 3
Ace Your Homework with AI
Get the answers you need in no time with our AI-driven, step-by-step assistance
Get Started
Cambridge IGCSE And O Level Additional Mathematics
Authors: Val Hanrahan, Jeanette Powell
1st Edition
1510421645, 978-1510421646