Answered step by step
Verified Expert Solution
Link Copied!

Question

1 Approved Answer

Figure 13-10 MC Costs and revenue per caso 22 ATC 16 14 13 12 Demand MR 22 24 30 38 Quantity (cases) Figure 13-10 shows
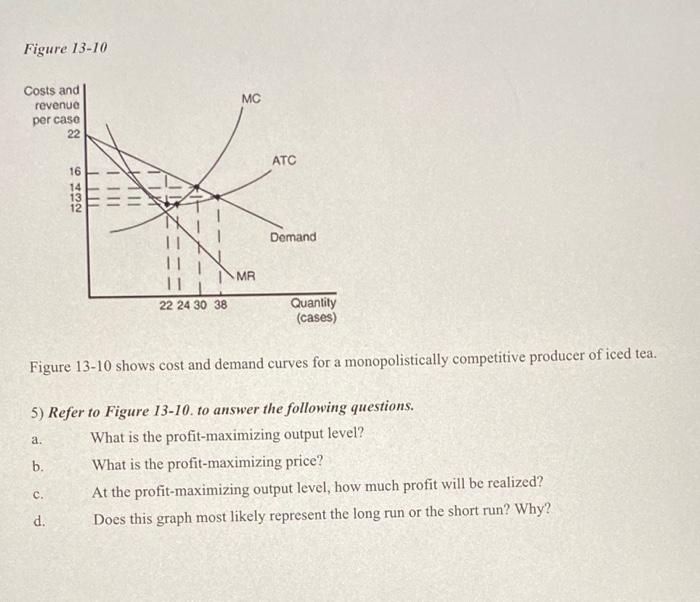
image text in transcribed
Figure 13-10 MC Costs and revenue per caso 22 ATC 16 14 13 12 Demand MR 22 24 30 38 Quantity (cases) Figure 13-10 shows cost and demand curves for a monopolistically competitive producer of iced tea. a. 5) Refer to Figure 13-10. to answer the following questions. What is the profit-maximizing output level? b. What is the profit-maximizing price? At the profit-maximizing output level, how much profit will be realized? d. Does this graph most likely represent the long run or the short run? Why? C

Step by Step Solution

There are 3 Steps involved in it

Step: 1

blur-text-image

Get Instant Access to Expert-Tailored Solutions

See step-by-step solutions with expert insights and AI powered tools for academic success

Step: 2

blur-text-image_2

Step: 3

blur-text-image_3

Ace Your Homework with AI

Get the answers you need in no time with our AI-driven, step-by-step assistance

Get Started

Recommended Textbook for

Life Audit Workbook Meant For More

Authors: Agnese Iskrova

1st Edition

1716274958, 978-1716274954

More Books

Students also viewed these Accounting questions