

Answered step by step
Verified Expert Solution
Question
1 Approved Answer
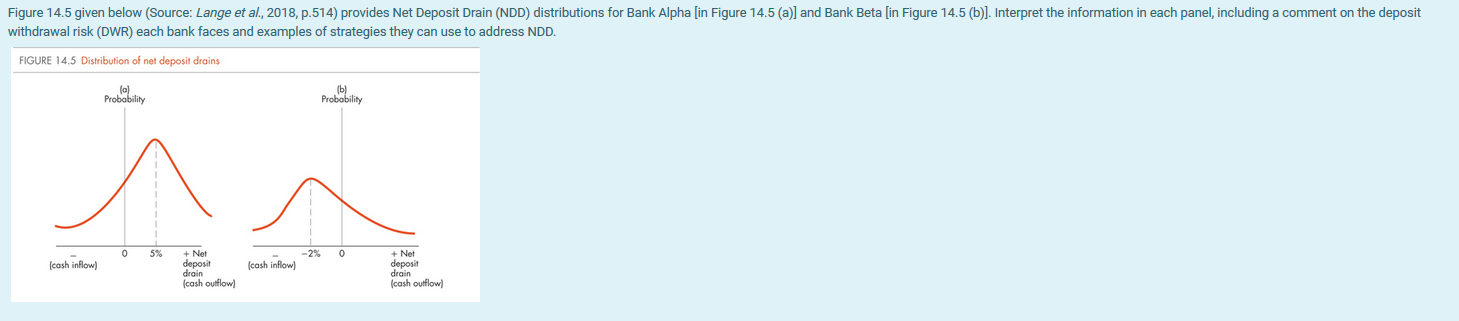
Figure 14.5 given below (Source: Lange et al., 2018, p.514) provides Net Deposit Drain (NDD) distributions for Bank Alpha (in Figure 14.5 (a)] and Bank
Step by Step Solution
There are 3 Steps involved in it
Step: 1

Get Instant Access to Expert-Tailored Solutions
See step-by-step solutions with expert insights and AI powered tools for academic success
Step: 2

Step: 3
Ace Your Homework with AI
Get the answers you need in no time with our AI-driven, step-by-step assistance
Get Started
Handbook Of Financial Planning And Control
Authors: Robert P. Greenwood
3rd Edition
0566083728, 978-0566083723