

Answered step by step
Verified Expert Solution
Question
1 Approved Answer
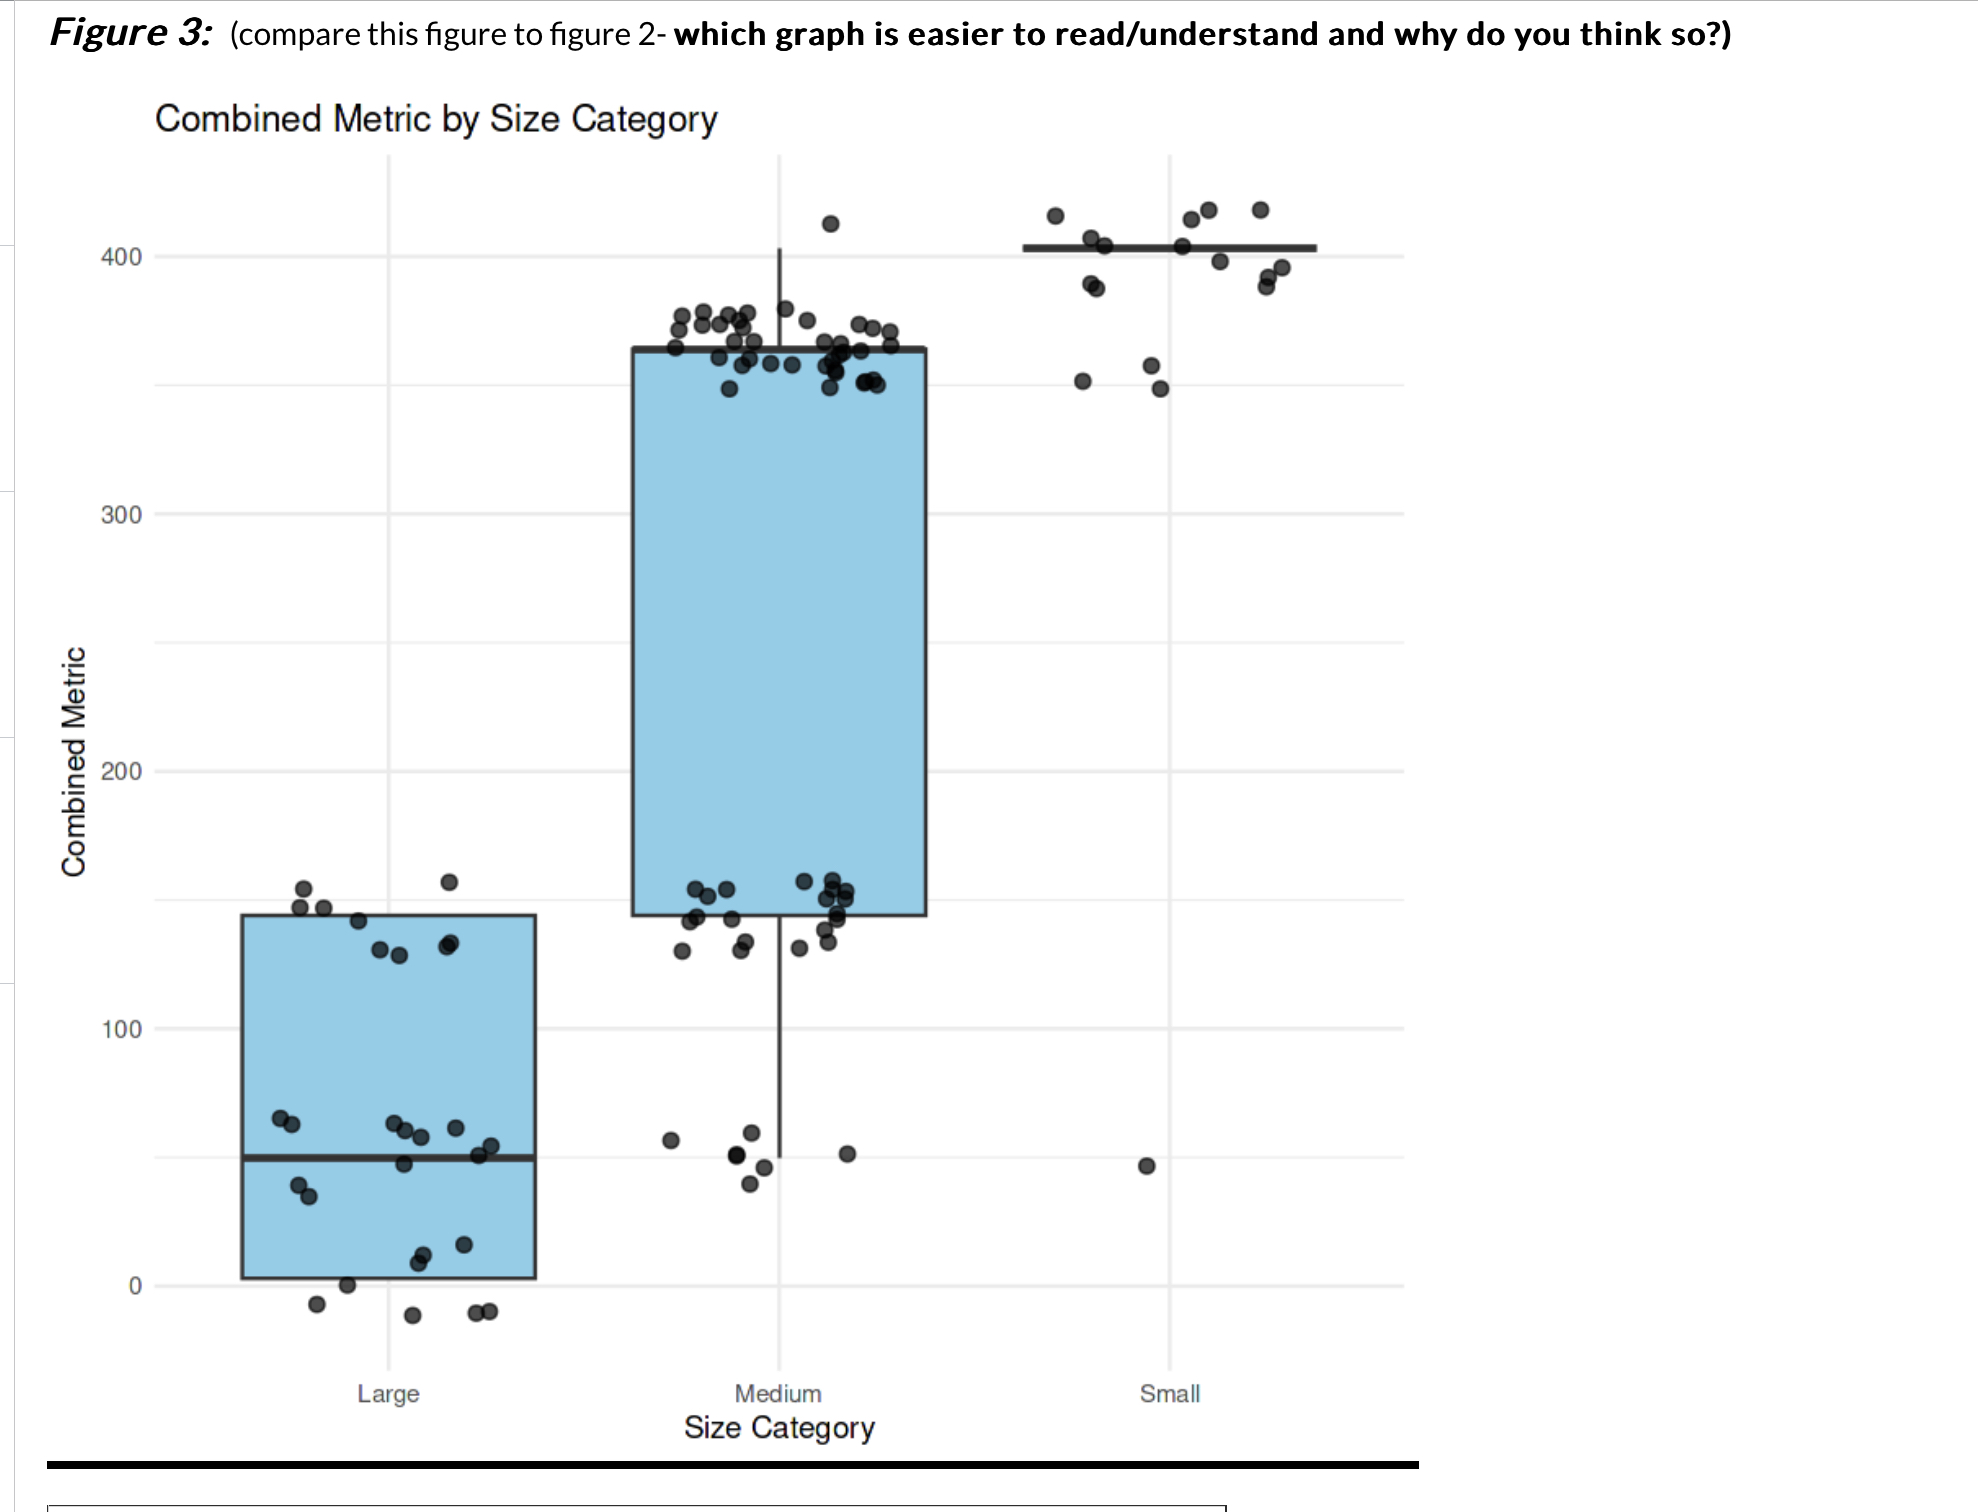
Figure 3: (compare this figure to figure 2- which graph is easier to read/understand and why do you think so?) Combined Metric by Size Category
Step by Step Solution
There are 3 Steps involved in it
Step: 1

Get Instant Access to Expert-Tailored Solutions
See step-by-step solutions with expert insights and AI powered tools for academic success
Step: 2

Step: 3
Ace Your Homework with AI
Get the answers you need in no time with our AI-driven, step-by-step assistance
Get Started
Finite Mathematics With Applications In The Management Natural And Social Sciences
Authors: Margaret Lial, Thomas Hungerford, John Holcomb, Bernadette Mullins
11th Edition
0321931068, 9780321931061