Answered step by step
Verified Expert Solution
Link Copied!

Question

1 Approved Answer

Figure 3: Lift Curves - Logistic Regression 2.5 Decision Tree Bootstrap Forest Boosted Tree 2.0 Lift 1.5 1.0 0.00 0.10 0.20 0.30 0.40 0.50 0.60
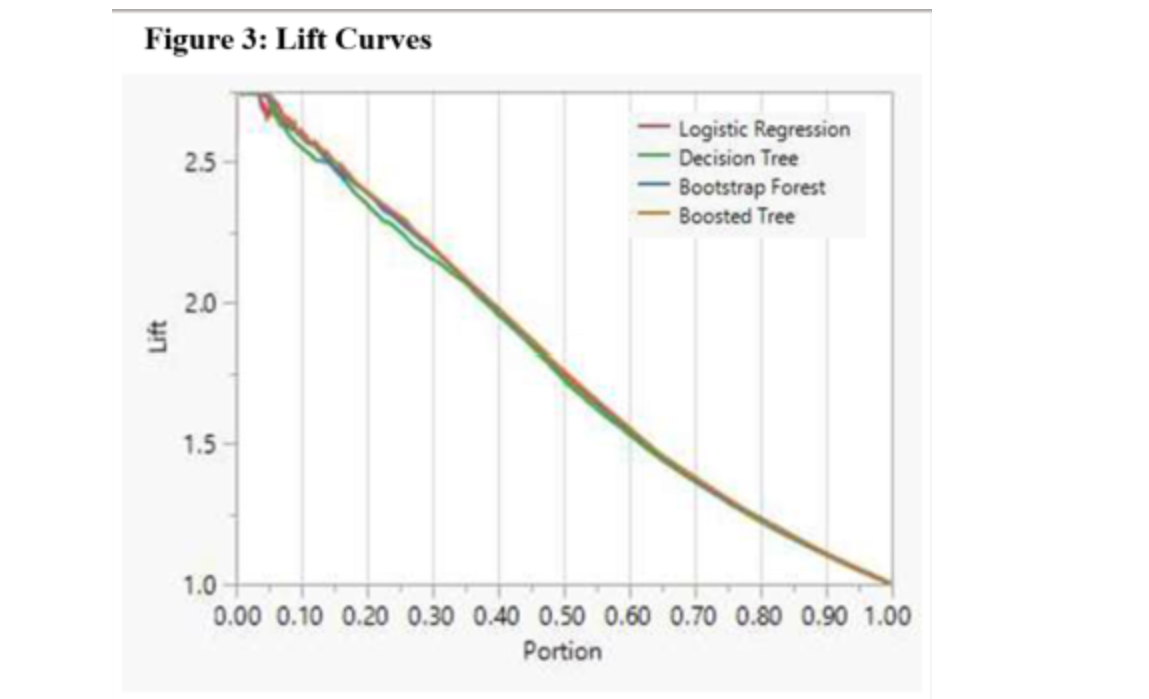
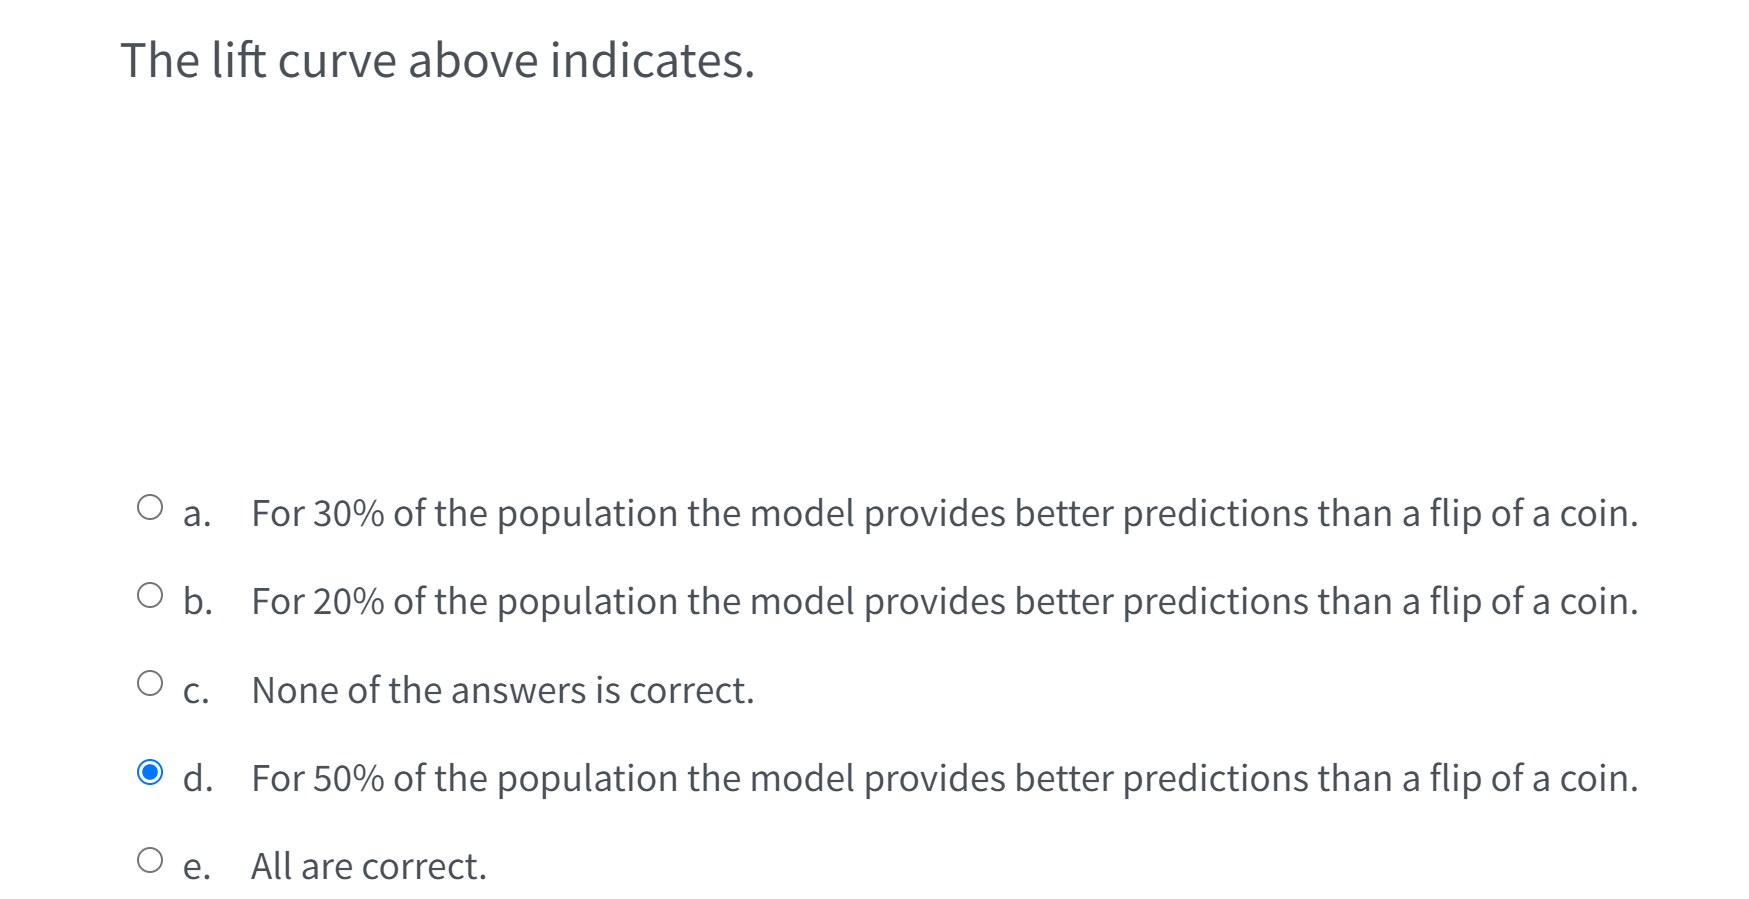
image text in transcribedimage text in transcribed
Figure 3: Lift Curves - Logistic Regression 2.5 Decision Tree Bootstrap Forest Boosted Tree 2.0 Lift 1.5 1.0 0.00 0.10 0.20 0.30 0.40 0.50 0.60 0.70 0.80 0.90 1.00 PortionThe lift curve above indicates. O a. For 30% of the population the model provides better predictions than a flip of a coin. O b. For 20% of the population the model provides better predictions than a flip of a coin. O c. None of the answers is correct. O d. For 50% of the population the model provides better predictions than a flip of a coin. O e. All are correct

Step by Step Solution

There are 3 Steps involved in it

Step: 1

blur-text-image

Get Instant Access to Expert-Tailored Solutions

See step-by-step solutions with expert insights and AI powered tools for academic success

Step: 2

blur-text-image

Step: 3

blur-text-image

Ace Your Homework with AI

Get the answers you need in no time with our AI-driven, step-by-step assistance

Get Started

Recommended Textbook for

Linear Algebra with Applications

Authors: Steven J. Leon

7th edition

131857851, 978-0131857858

More Books

Students also viewed these Mathematics questions