

Answered step by step
Verified Expert Solution
Question
1 Approved Answer
FIGURES FROM Exhibit 8.3 Part I Using a calculator Initial cash outlay CF- Present value of CF Present value of CF Present value of CF
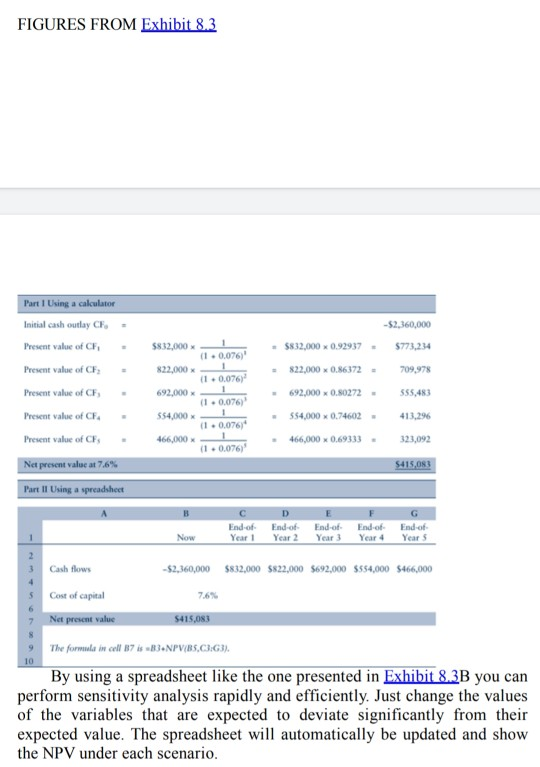
FIGURES FROM Exhibit 8.3 Part I Using a calculator Initial cash outlay CF- Present value of CF Present value of CF Present value of CF Present value of CF. Present value of CF, Net present value at 7.6% Part I Using a spreadsheet $832,000 ( 10.076)' 822,000 11. 0.076) 692,000 ( 10.076) 554.000 (10.076 466,000 1 11. 0.076) -$2,360,000 $832,000 0.92937 $773,234 822,000 0.86372 - 709,978 - 692,000 0.80272 555,483 554,000 0.74602 413,296 466,000 x 0.69333 323,092 5415,083 D End-of Year 2 End of Year 1 End of Year 3 End-of- Year 4 Now G End-of Years 2 3 Cash flows -$2,360,000 $832,000 $822,000 $692,000 $554,000 $466,000 5 Cost of capital 7.6% Net present value $415.08 8 9 10 The formula in cell 37 is -83.NPV(B5,C3:3). By using a spreadsheet like the one presented in Exhibit 8.3B you can perform sensitivity analysis rapidly and efficiently. Just change the values of the variables that are expected to deviate significantly from their expected value. The spreadsheet will automatically be updated and show the NPV under each scenario. FIGURES FROM Exhibit 8.3 Part I Using a calculator Initial cash outlay CF- Present value of CF Present value of CF Present value of CF Present value of CF. Present value of CF, Net present value at 7.6% Part I Using a spreadsheet $832,000 ( 10.076)' 822,000 11. 0.076) 692,000 ( 10.076) 554.000 (10.076 466,000 1 11. 0.076) -$2,360,000 $832,000 0.92937 $773,234 822,000 0.86372 - 709,978 - 692,000 0.80272 555,483 554,000 0.74602 413,296 466,000 x 0.69333 323,092 5415,083 D End-of Year 2 End of Year 1 End of Year 3 End-of- Year 4 Now G End-of Years 2 3 Cash flows -$2,360,000 $832,000 $822,000 $692,000 $554,000 $466,000 5 Cost of capital 7.6% Net present value $415.08 8 9 10 The formula in cell 37 is -83.NPV(B5,C3:3). By using a spreadsheet like the one presented in Exhibit 8.3B you can perform sensitivity analysis rapidly and efficiently. Just change the values of the variables that are expected to deviate significantly from their expected value. The spreadsheet will automatically be updated and show the NPV under each scenario
Step by Step Solution
There are 3 Steps involved in it
Step: 1

Get Instant Access to Expert-Tailored Solutions
See step-by-step solutions with expert insights and AI powered tools for academic success
Step: 2

Step: 3
Ace Your Homework with AI
Get the answers you need in no time with our AI-driven, step-by-step assistance
Get Started
Fintech For Finance Professionals
Authors: David Kuo Chuen Lee, Joseph Lim, Kok Fai Phoon, Yu Wang
1st Edition
9811241864, 978-9811241864