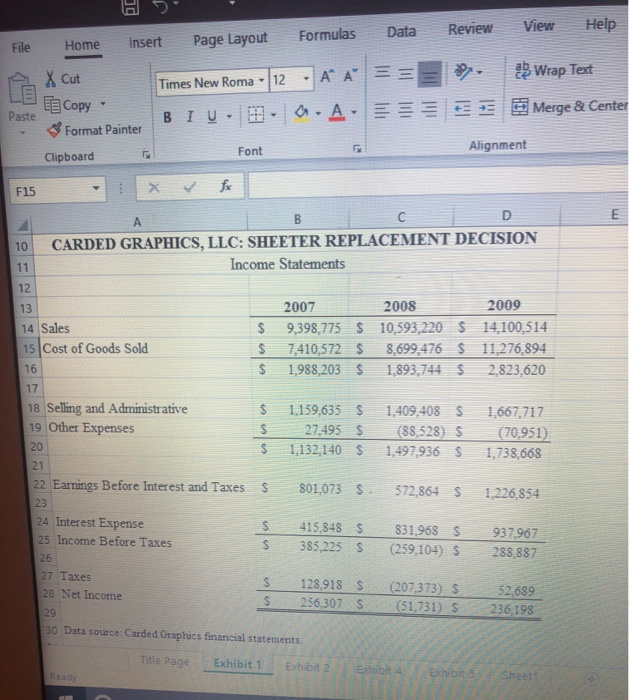
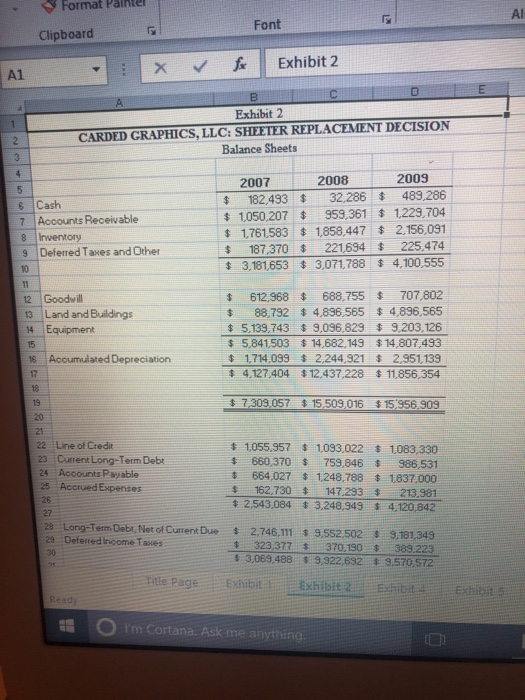
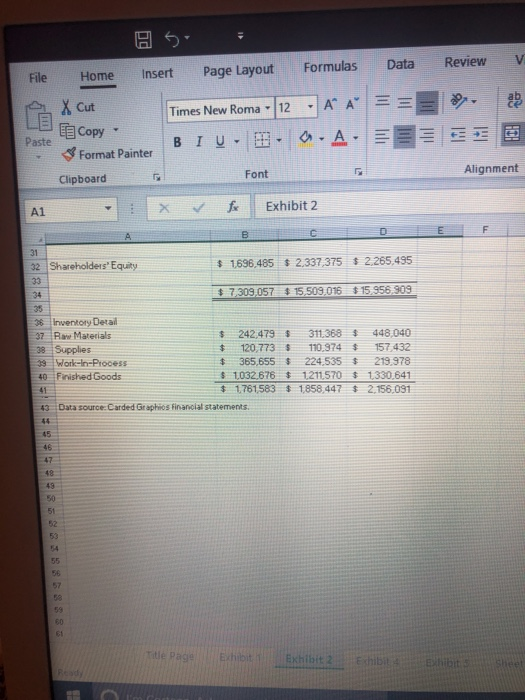
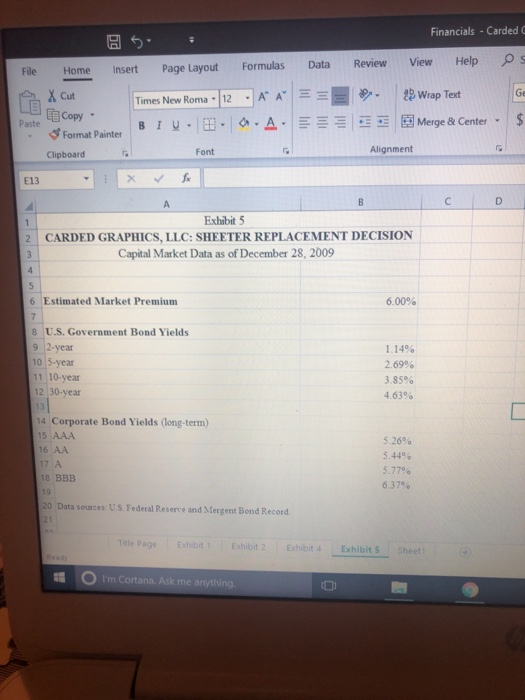
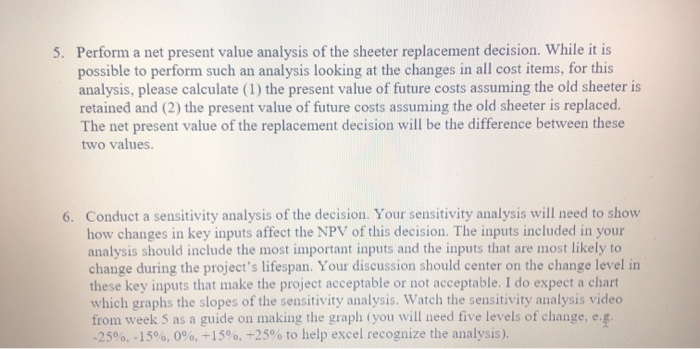
File Home insert Page Layout Formulas Data Review View Help 19-1wrap Text Times New Roma-11-A"A"! EECopy Paste 1Merge & Center Center A- ! + | B 1-| Format Painter Alignment Font Clipboard F15 10 CARDED GRAPHICS, LLC: SHEETER REPLACEMENT DECISION Income Statements 12 2009 2008 2007 13 14 Sales S 9,398,775 S 10,593,220 14,100,514 15 Cost of Goods Sold S 7,410,572 8,699,476 S 11,276,894 16 S 1,988,203 S1,893,744 $ 2,823,620 17 18 Selling and Administrative 19 Other Expenses $ 1,159,635 1,409408 1,667,717 27.495 S (88528) S (70951) 1,132,140 S 1,497,936 S 1,738,668 20 21 22 Earnings Before Interest and Taxes 801,073 572,864 1,226,854 23 24 Interest Expense S 415,848 S831968 937967 S 385,225 S (259,104) S 288,887 25 Income Before Taxes 26 27 Taxes S 128,918 S (207,373) S S 256,307 S (51,731) S 52,639 28 Net Income 236,198 29 30 Data source: Carded Graphics financial statements Title Page Exhibit 1 Exhibit 2 Format Pntel Al Font Clipboard Exhibit 2 Al Exhibit 2 CARDED GRAPHICS, LLC: SHEETER REPLACEMENT DECISION Balance Sheets 2009 2008 2007 $182,49332,286 $ 489.286 6 Cash 7 Accounts Receivable $ 1050.207$959.361 $ 1.229.704 s 1,761583 1,858,447 2.156,091 $ 187.370 221694 225474 $ 3,181,653 s 3,071,788 $4,100.555 8 Inventory 9 Deferred Tases and Other 10 $ 612,968 688,755 707,802 $ 88,792 4,836,565 $4896,565 $5,139,743 9,096,829 9.203,126 5,84150314,682.14914,807,493 12 Good ill 13 Land and Buildings 14 Equipment 15 18 Acoumulated Depreciation 1.714,039 t 2,244,9212,951,139 4.127 404 $12,437,228 $11856,354 18 7,309057 15,509,016 $15,956.909 19 20 22 Line of Credit s 1,055.957 s 1093,022 $ 1,083,330 s 660370 759,846986,531 s 664,027 s 1.248,788 1837,000 23 Current Long-Term Debt 24 Accounits Pavable 25 Accrued Expenses 162.730147293213 981 s 2,543,084 3,248.949 4 120,842 26 27 2s Long-Term Debt,Net of Curent Due $ 2,746,111 9,552502 s 3 181 349 323,377 370.190 383.223 s 3,069,488 $ 9,322,632 9.570 572 29 Defered Income Taues 30 tle Page Exhibit i Exhibit 2Exhibit I'm Cortana. Ask me anythin File Home Insert Page Layout FormulasData Review v Times New Roma. | 12-1A" | Cut Copy Paste Alignment Font Clipboard 11 Exhibit 2 -X- A1 31 1696.485 2.337,375 2265,495 32 Shareholdens Equity 34. 35 3 Inventory Detal 37 Raw Materials s 242479 311368 448,040 $ 120,773 110.974 157,432 365,655 224.535 $ 219.,978 s 1032,676$ 1.211,570$ 1330.641 8 Supplies 39 E Work-In-Process 40 Finished Goods $ 1761583 $ 1,858.447 2.156,091 41 Data source Carded Graphios Financial statements 47 43 60 Exhibit 2E Financials-Carded 5. File Home Insert Page Layout Formulas Data Review View Help s Times New Roma-112-1A"A"|9-00wrap Tent . | Ge Wrap Text Cut Copy . ! +E-FRI Merge & Center Paste B 1 u . | Format Painter Alignment Font Clipboard E13 Exhibit 5 CARDED GRAPHICS, LLC: SHEETER REPLACEMENT DECISION Capital Market Data as of December 28, 2009 2 6 Estimated Market Premium 6.00% 8 U.S. Government Bond Yields 9 2-year 10 5-year 1 10-year 1.14% 2.69% 3.85% 2 30-year 4.63% 4 Corporate Bond Yields (long-term) 5.26% 5.44% 6 AA .77% 6.37% 0 Data sources: U'S Federal Reserve and Mergent Bond Record Title Page Exhibit Eshibit 2Exhibit 4 Exhibit S Sheet I'm Cortana. Ask me anything Perform a net present value analysis of the sheeter replacement decision. While it is possible to perform such an analysis looking at the changes in all cost items, for this analysis, please calculate (1) the present value of future costs assuming the old sheeter is retained and (2) the present value of future costs assuming the old sheeter is replaced. The net present value of the replacement decision will be the difference between these two values. 5. Conduct a sensitivity analysis of the decision. Your sensitivity analysis will need to show how changes in key inputs affect the NPV of this decision. The inputs included in your analysis should include the most important inputs and the inputs that are most likely to change during the project's lifespan. Your discussion should center on the change level in these key inputs that make the project acceptable or not acceptable. I do expect a chart which graphs the slopes of the sensitivity analysis. Watch the sensitivity analysis video from week 5 as a guide on making the graph (you will need five levels of change, e. -25%,-15%, 0%,-15%,-25% to help excel recognize the analysis) 6. File Home insert Page Layout Formulas Data Review View Help 19-1wrap Text Times New Roma-11-A"A"! EECopy Paste 1Merge & Center Center A- ! + | B 1-| Format Painter Alignment Font Clipboard F15 10 CARDED GRAPHICS, LLC: SHEETER REPLACEMENT DECISION Income Statements 12 2009 2008 2007 13 14 Sales S 9,398,775 S 10,593,220 14,100,514 15 Cost of Goods Sold S 7,410,572 8,699,476 S 11,276,894 16 S 1,988,203 S1,893,744 $ 2,823,620 17 18 Selling and Administrative 19 Other Expenses $ 1,159,635 1,409408 1,667,717 27.495 S (88528) S (70951) 1,132,140 S 1,497,936 S 1,738,668 20 21 22 Earnings Before Interest and Taxes 801,073 572,864 1,226,854 23 24 Interest Expense S 415,848 S831968 937967 S 385,225 S (259,104) S 288,887 25 Income Before Taxes 26 27 Taxes S 128,918 S (207,373) S S 256,307 S (51,731) S 52,639 28 Net Income 236,198 29 30 Data source: Carded Graphics financial statements Title Page Exhibit 1 Exhibit 2 Format Pntel Al Font Clipboard Exhibit 2 Al Exhibit 2 CARDED GRAPHICS, LLC: SHEETER REPLACEMENT DECISION Balance Sheets 2009 2008 2007 $182,49332,286 $ 489.286 6 Cash 7 Accounts Receivable $ 1050.207$959.361 $ 1.229.704 s 1,761583 1,858,447 2.156,091 $ 187.370 221694 225474 $ 3,181,653 s 3,071,788 $4,100.555 8 Inventory 9 Deferred Tases and Other 10 $ 612,968 688,755 707,802 $ 88,792 4,836,565 $4896,565 $5,139,743 9,096,829 9.203,126 5,84150314,682.14914,807,493 12 Good ill 13 Land and Buildings 14 Equipment 15 18 Acoumulated Depreciation 1.714,039 t 2,244,9212,951,139 4.127 404 $12,437,228 $11856,354 18 7,309057 15,509,016 $15,956.909 19 20 22 Line of Credit s 1,055.957 s 1093,022 $ 1,083,330 s 660370 759,846986,531 s 664,027 s 1.248,788 1837,000 23 Current Long-Term Debt 24 Accounits Pavable 25 Accrued Expenses 162.730147293213 981 s 2,543,084 3,248.949 4 120,842 26 27 2s Long-Term Debt,Net of Curent Due $ 2,746,111 9,552502 s 3 181 349 323,377 370.190 383.223 s 3,069,488 $ 9,322,632 9.570 572 29 Defered Income Taues 30 tle Page Exhibit i Exhibit 2Exhibit I'm Cortana. Ask me anythin File Home Insert Page Layout FormulasData Review v Times New Roma. | 12-1A" | Cut Copy Paste Alignment Font Clipboard 11 Exhibit 2 -X- A1 31 1696.485 2.337,375 2265,495 32 Shareholdens Equity 34. 35 3 Inventory Detal 37 Raw Materials s 242479 311368 448,040 $ 120,773 110.974 157,432 365,655 224.535 $ 219.,978 s 1032,676$ 1.211,570$ 1330.641 8 Supplies 39 E Work-In-Process 40 Finished Goods $ 1761583 $ 1,858.447 2.156,091 41 Data source Carded Graphios Financial statements 47 43 60 Exhibit 2E Financials-Carded 5. File Home Insert Page Layout Formulas Data Review View Help s Times New Roma-112-1A"A"|9-00wrap Tent . | Ge Wrap Text Cut Copy . ! +E-FRI Merge & Center Paste B 1 u . | Format Painter Alignment Font Clipboard E13 Exhibit 5 CARDED GRAPHICS, LLC: SHEETER REPLACEMENT DECISION Capital Market Data as of December 28, 2009 2 6 Estimated Market Premium 6.00% 8 U.S. Government Bond Yields 9 2-year 10 5-year 1 10-year 1.14% 2.69% 3.85% 2 30-year 4.63% 4 Corporate Bond Yields (long-term) 5.26% 5.44% 6 AA .77% 6.37% 0 Data sources: U'S Federal Reserve and Mergent Bond Record Title Page Exhibit Eshibit 2Exhibit 4 Exhibit S Sheet I'm Cortana. Ask me anything Perform a net present value analysis of the sheeter replacement decision. While it is possible to perform such an analysis looking at the changes in all cost items, for this analysis, please calculate (1) the present value of future costs assuming the old sheeter is retained and (2) the present value of future costs assuming the old sheeter is replaced. The net present value of the replacement decision will be the difference between these two values. 5. Conduct a sensitivity analysis of the decision. Your sensitivity analysis will need to show how changes in key inputs affect the NPV of this decision. The inputs included in your analysis should include the most important inputs and the inputs that are most likely to change during the project's lifespan. Your discussion should center on the change level in these key inputs that make the project acceptable or not acceptable. I do expect a chart which graphs the slopes of the sensitivity analysis. Watch the sensitivity analysis video from week 5 as a guide on making the graph (you will need five levels of change, e. -25%,-15%, 0%,-15%,-25% to help excel recognize the analysis) 6