Answered step by step
Verified Expert Solution
Question
1 Approved Answer
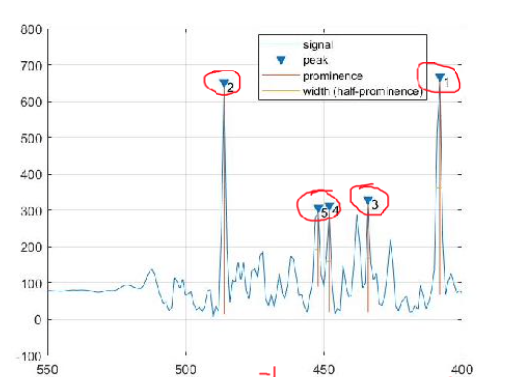
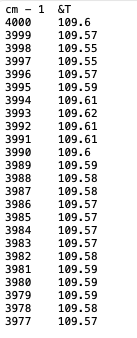
fileID = fopen(filename) s=textscan(fid,'%f %f','headerlines',2); g = cell2mat(s) findpeaks(sortedY,sortedX,'MinPeakProminence',4,'Annotate','extents'); Use the above code/programming in MATLAB to turn into a graph that looks like below: Using
fileID = fopen(filename) s=textscan(fid,'%f %f','headerlines',2); g = cell2mat(s) findpeaks(sortedY,sortedX,'MinPeakProminence',4,'Annotate','extents');
Use the above code/programming in MATLAB to turn into a graph that looks like below:

Using the following dataset:

Step by Step Solution
There are 3 Steps involved in it
Step: 1

Get Instant Access to Expert-Tailored Solutions
See step-by-step solutions with expert insights and AI powered tools for academic success
Step: 2

Step: 3

Ace Your Homework with AI
Get the answers you need in no time with our AI-driven, step-by-step assistance
Get Started


