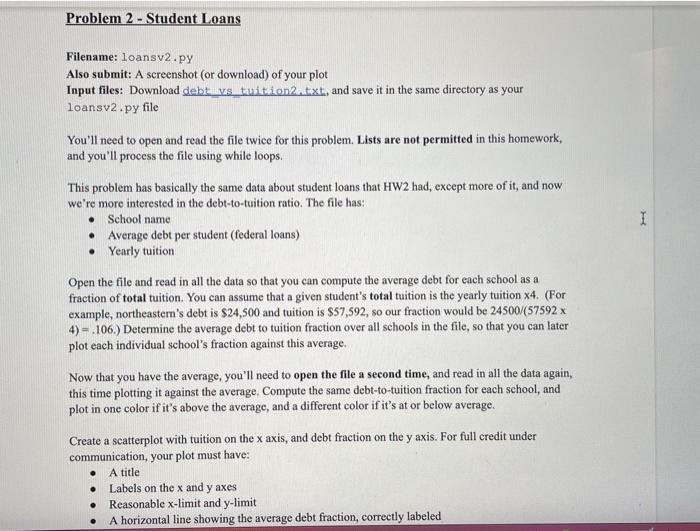
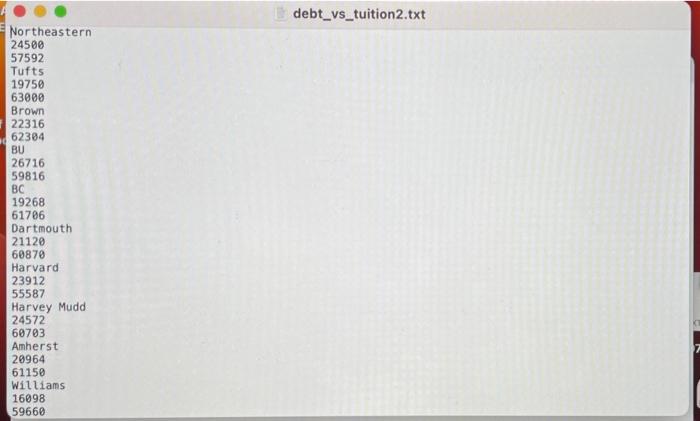
Filename: loansv2.py Also submit: A screenshot (or download) of your plot Input files: Download debt vs tuition 2.tixt, and save it in the same directory as your loansv2,py file You'll need to open and read the file twice for this problem. Lists are not permitted in this homework, and you'll process the file using while loops. This problem has basically the same data about student loans that HW2 had, except more of it, and now we're more interested in the debt-to-tuition ratio. The file has: - School name - Average debt per student (federal loans) - Yearly tuition Open the file and read in all the data so that you can compute the average debt for each school as a fraction of total tuition. You can assume that a given student's total tuition is the yearly tuition 4. (For example, northeastern's debt is $24,500 and tuition is $57,592, so our fraction would be 24500/(57592 4) =.106.) Determine the average debt to tuition fraction over all schools in the file, so that you can later plot each individual school's fraction against this average. Now that you have the average, you'll need to open the file a second time, and read in all the data again, this time plotting it against the average. Compute the same debt-to-tuition fraction for each school, and plot in one color if it's above the average, and a different color if it's at or below average. Create a scatterplot with tuition on the x axis, and debt fraction on the y axis. For full credit under communication, your plot must have: - A title - Labels on the x and y axes - Reasonable x-limit and y-limit - A horizontal line showing the average debt fraction, correctly labeled debt_vs_tuition2.txt Northeastern 24506 57592 Tufts 19750 63000 Brown 22316 62384 BU 26716 59816 BC 19268 61706 Dartmouth 21120 60870 Harvard 23912 55587 Harvey Mudd 24572 60703 Amherst 20964 61150 Williams 16098 59660