

Answered step by step
Verified Expert Solution
Question
1 Approved Answer
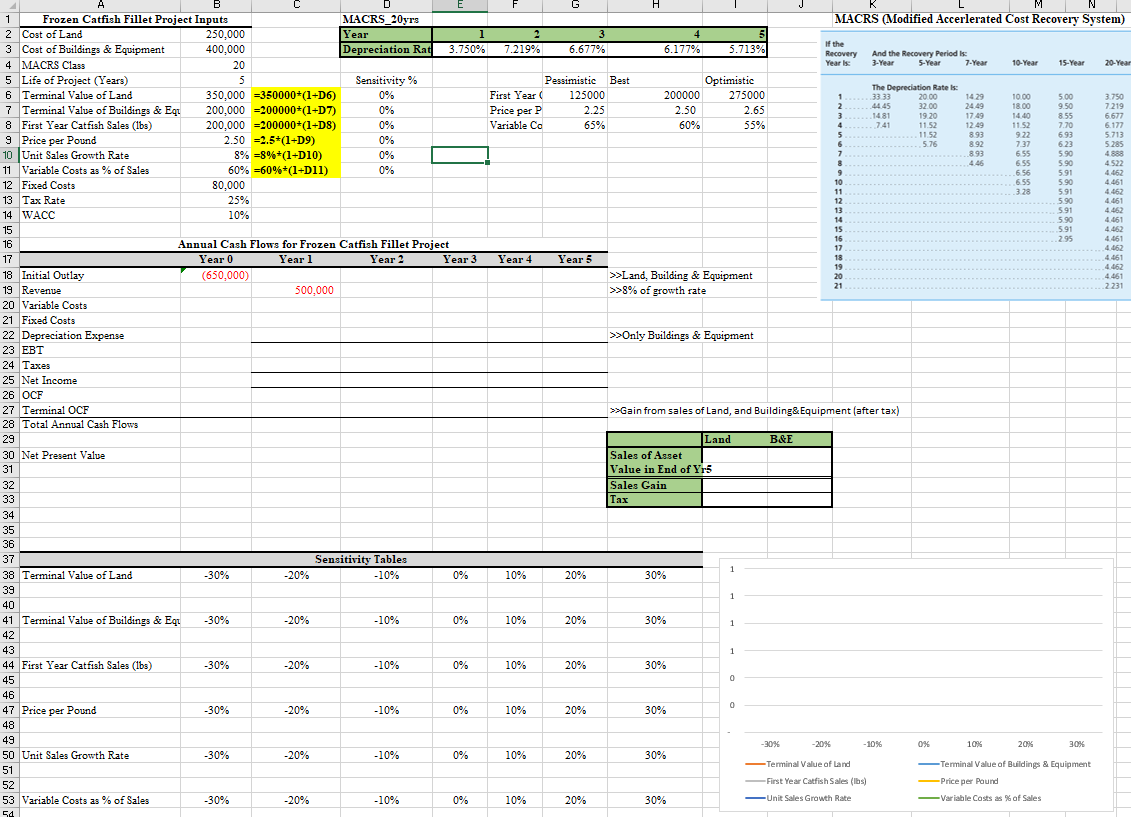
Fill in all available areas and show formulas 855 4 7 9 15 17 19 21 A D G H 1 1 Frozen Catfish Fillet
 Fill in all available areas and show formulas
Step by Step Solution
There are 3 Steps involved in it
Step: 1

Get Instant Access to Expert-Tailored Solutions
See step-by-step solutions with expert insights and AI powered tools for academic success
Step: 2

Step: 3
Ace Your Homework with AI
Get the answers you need in no time with our AI-driven, step-by-step assistance
Get Started
Research In Finance
Authors: John W. Kensinger
1st Edition
0857245414, 978-0857245410