Fill in distribution tables and perform average, variance and standard deviation computations Create 3 graphs, time series, values distribution, z score distribution
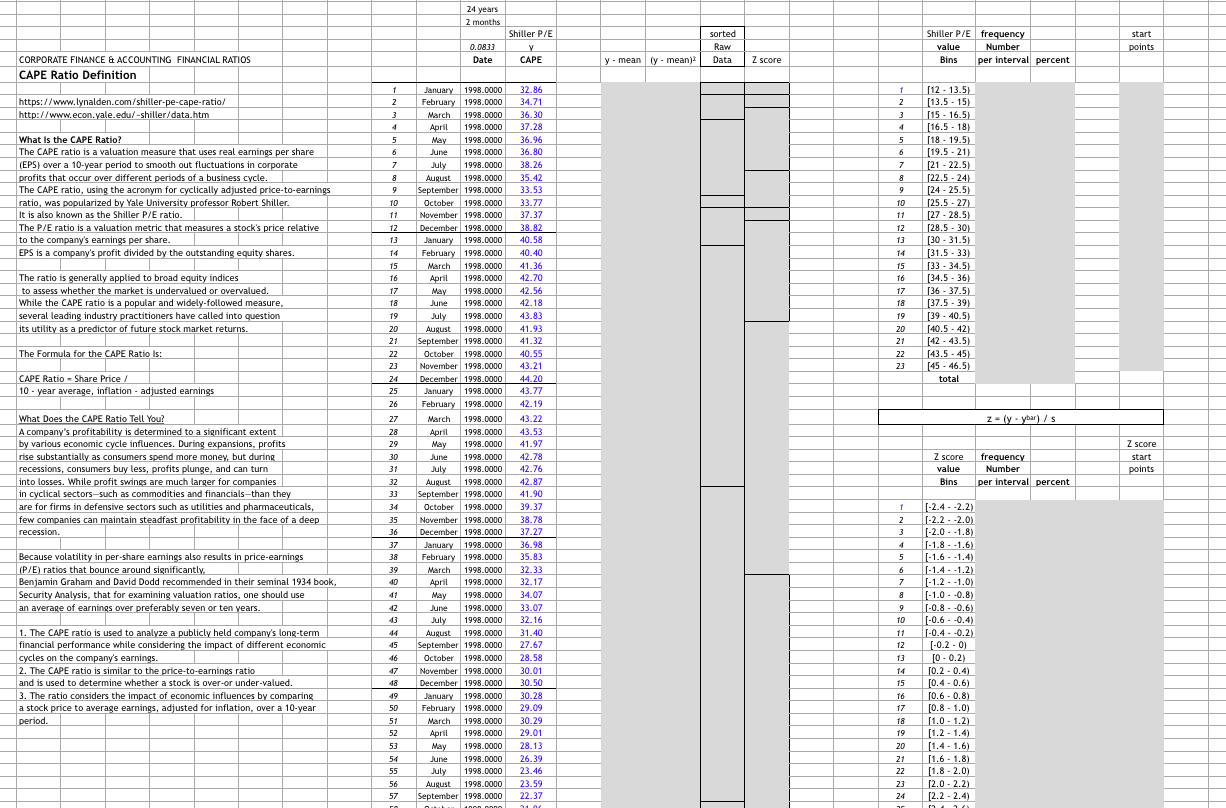
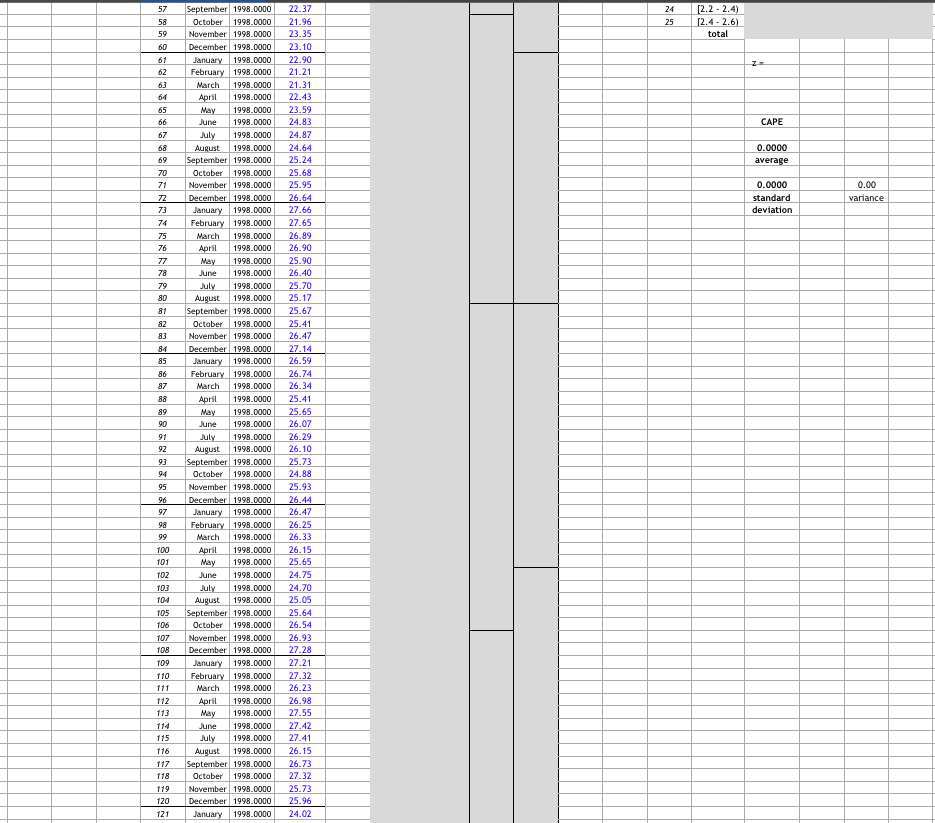
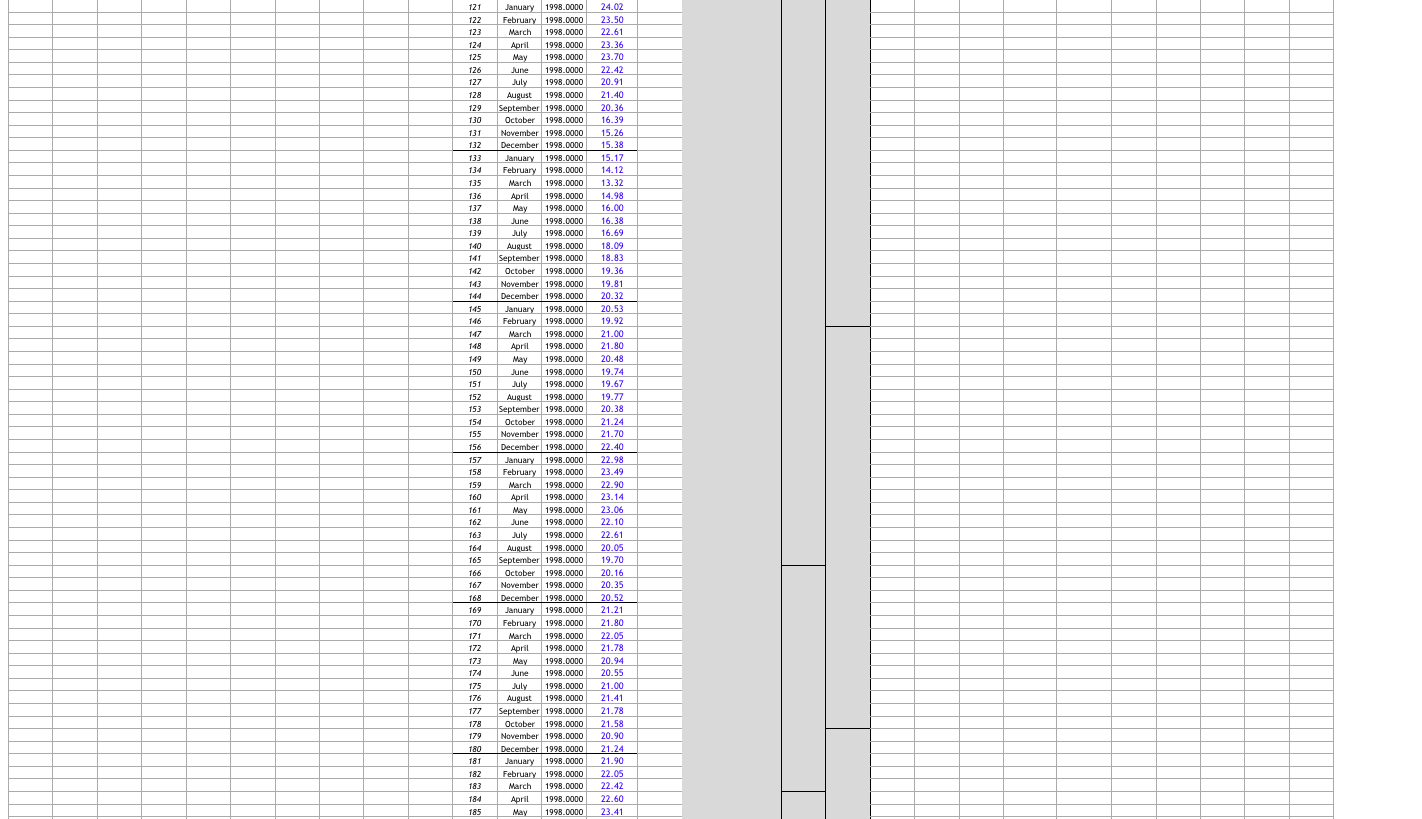
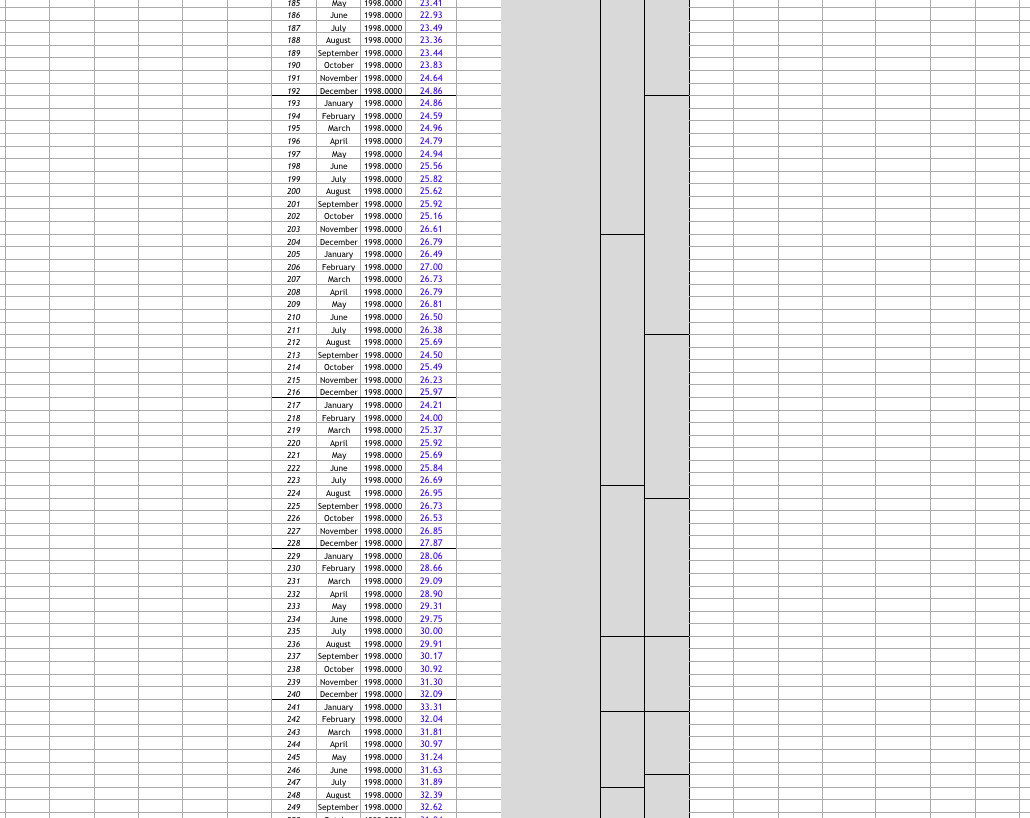
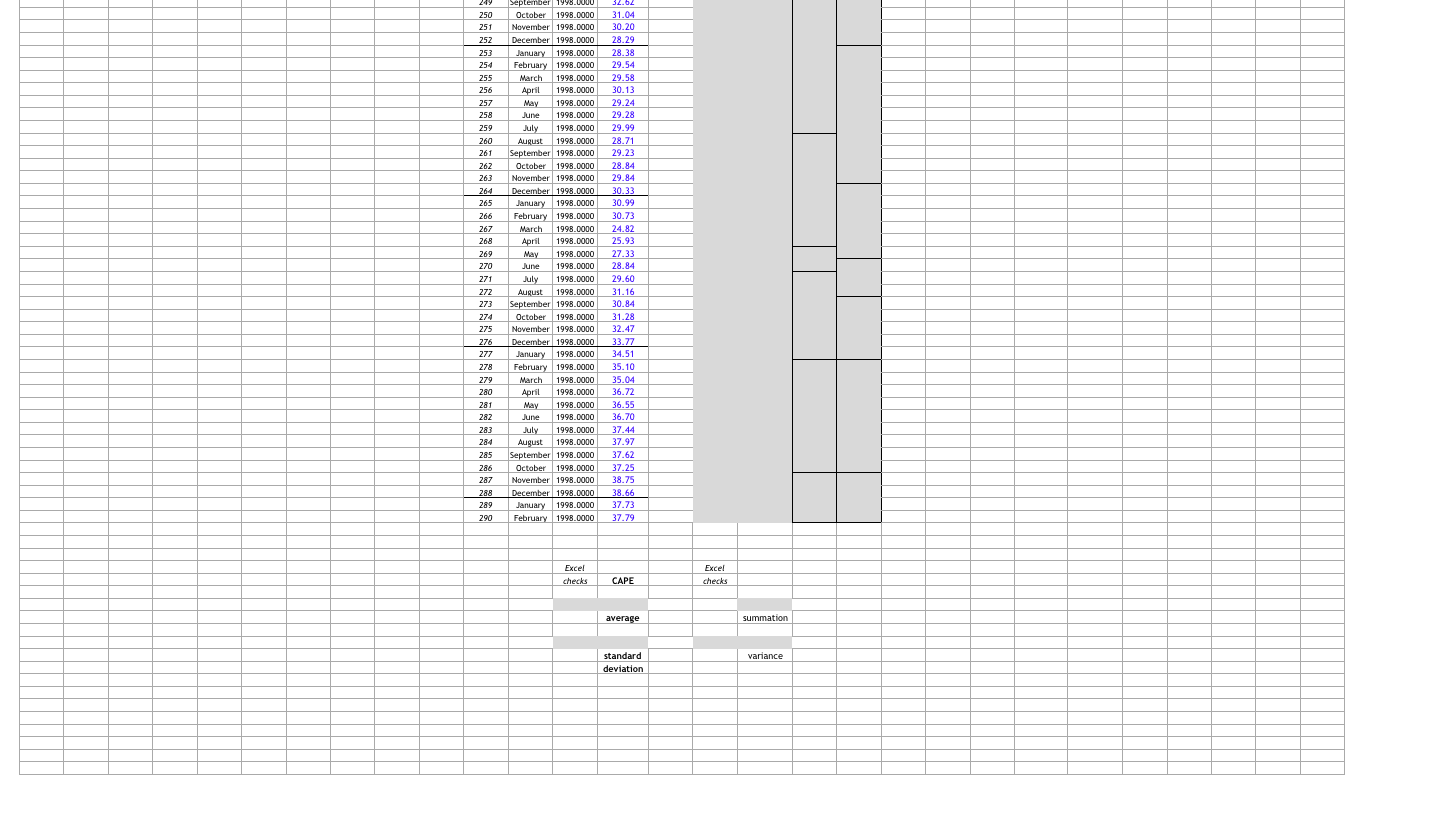
24 years 2 months Shiller P/E V CAPE 0.0833 Date sorted Raw Data Shiller P/E frequency value Number Bins per interval percent start points y - mean ly. mean) Z score CORPORATE FINANCE & ACCOUNTING FINANCIAL RATIOS CAPE Ratio Definition sercent https://www.lynalden.com/shiller-pe-cape-ratio/ http://www.econ.yale.edu/-shiller/data.htm 1 2 3 4 1 2 3 5 6 7 5 6 7 8 9 What is the CAPE Ratio? The CAPE ratio is a valuation measure that uses real earnings per share (EPS) over a 10-year period to smooth out fluctuations in corporate profits that occur over different periods of a business cycle. The CAPE ratio, using the acronym for cyclically adjusted price-to-earnings ratio, was popularized by Yale University professor Robert Shiller. It is also known as the Shiller P/E ratio. The P/E ratio is a valuation metric that measures a stock's price relative to the company's earnings per share. EPS is a company's profit divided by the outstanding equity shares. 8 9 9 10 11 12 13 14 15 16 17 10 11 12 13 14 15 16 17 18 [12 - 13.5) [13.5 - 15) 15 - 16.5) (16.5 -18) [18-19.5) [19.5-21) [21-22.5) [22.5-24) [24-25.5) [25.5 -27) [27-28.5) [28.5 - 30) (30-31.5) (31.5 - 33) [33 - 34.5) (34.5 - 36) 36 - 37.5) 37.5 - 39) [39 - 40.5) [40.5 - 42) [42-43.5) [43.5 - 45) [45 - 46.5) total The ratio is generally applied to broad equity indices to assess whether the market is undervalued or overvalued. While the CAPE ratio is a popular and widely-followed measure, several leading industry practitioners have called into question its utility as a predictor of future stock market returns 18 19 20 21 22 23 24 25 26 19 20 21 22 23 The Formula for the CAPE Ratio is: CAPE Ratio - Share Price 10-year average, inflation - adjusted earnings 27 Z-ly-ybar) / S 28 29 January 1998.0000 32.86 February 1998.0000 34.71 March 1998.0000 36.30 April 1998.0000 37.28 May 1998.0000 36.96 June 1998.0000 36.80 July 1998.0000 38.26 August 1998.0000 35.42 September 1998.0000 33.53 October 1998.0000 33.77 November 1998.0000 37.37 December 1998.0000 38.82 January 1998.0000 40.58 February 1998.0000 40.40 March 1998.0000 41.36 April 1998.0000 42.70 May 1998.0000 42.56 June 1998.0000 42.18 July 1998.0000 43.83 August 1998.0000 41.93 September 1998.0000 41.32 October 1998.0000 40.55 November 1998.0000 43.21 December 1998.0000 44.20 January 1998.0000 43.77 February 1998.0000 42.19 March 1998.0000 43.22 April 1998.0000 43.53 May 1998.0000 41.97 June 1998.0000 July 1998.0000 42.76 August 1998.0000 42.87 September 1998.0000 41.90 October 1998.0000 39.37 November 1998.0000 38.78 December 1998.0000 37.27 January 1998.0000 36.98 February 1998.0000 35.83 March 1998.0000 32.33 April 1998.0000 32.17 May 1998.0000 34.07 June 1998.0000 33.07 July 1998.0000 32.16 August 1998.0000 31.40 September 1998.0000 27.67 October 1998.0000 28.58 November 1998.0000 30.01 December 1998.0000 30.50 January 1998.0000 30.28 February 1998.0000 29.09 March 1998.0000 30.29 April 1998.0000 29.01 May 1998.0000 28.13 June 1998.0000 26.39 July 1998.0000 23.46 August 1998.0000 23.59 September 1998.0000 22.37 42.78 What Does the CAPE Ratio Tell You? A company's profitability is determined to a significant extent by various economic cycle influences. During expansions, profits rise substantially as consumers spend more money, but during recessions, consumers buy less, profits plunge, and can turn into losses. While profit swings are much larger for companies in cyclical sectors such as commodities and financials-than they are for firms in defensive sectors such as utilities and pharmaceuticals, few companies can maintain steadfast profitability in the face of a deep recession. Z score start points 30 31 32 33 34 Z score value Bins frequency Number per interval percent 1 2 3 35 36 37 38 4 39 Because volatility in per-share eamings also results in price-earnings (P/E) ratios that bounce around significantly Benjamin Graham and David Dodd recommended in their seminal 1934 book, Security Analysis, that for examining valuation ratios, one should use an average of earnings over preferably seven or ten years. 40 5 6 6 7 8 9 10 1. The CAPE ratio is used to analyze a publicly held company's long-term financial performance while considering the impact of different economic cycles on the company's earnings. 2. The CAPE ratio is similar to the price-to-earnings ratio and is used to determine whether a stock is over-or under-valued. 3. The ratio considers the impact of economic influences by comparing a stock price to average earnings, adjusted for inflation, over a 10-year period 42 43 44 45 46 47 48 11 12 13 14 15 [-2.4 -2.2) -2.2 - 2.0) [-2.0.1.8) -1.8.-1.6) [-1.6 -1.4) [-1.4-1.2) [-1.2..1.0) [-1.0.0.8) -0.8 -0.6) -0.6 -0.4) -0.4 - -0.2) (-0.20) [O- 0.2) 10.2 - 0.4) 0.4-0.6) 0.6 - 0.8) [0.8 - 1.0) 1.0 - 1.2) (1.2 - 1.4) [1.4 - 1.6) (1.6 - 1.8) (1.8 - 2.0) [2.0 - 2.2) [2.2 - 2.4) 16 17 18 49 50 51 52 53 54 55 56 57 19 20 21 22 23 24 57 24 25 [2.2 - 2.4) [2.4 - 2.6) total 58 59 60 61 62 CAPE July 0.0000 average 64 65 66 67 68 69 70 71 72 73 74 75 76 77 78 79 80 81 0.0000 standard deviation 0.00 variance 82 83 84 85 86 87 88 89 September 1998.0000 October 1998.0000 November 1998.0000 December 1998.0000 January 1998.0000 February 1998.0000 March 1998.0000 April 1998.0000 May 1998.0000 June 1998.0000 1998.0000 August 1998.0000 September 1998.0000 October 1998.0000 November 1998.0000 December 1998.0000 January 1998.0000 February 1998.0000 March 1998.0000 April 1998.0000 May 1998.0000 June 1998.0000 July 1998.0000 August 1998.0000 September 1998.0000 October 1998.0000 November 1998.0000 December 1998.0000 January 1998.0000 February 1998.0000 March 1998.0000 April 1998.0000 May 1998.0000 June 1998.0000 July 1998.0000 August 1998.0000 September 1998.0000 October 1998.0000 November 1998.0000 December 1998.0000 January 1998.0000 February 1998.0000 March 1998.0000 April 1998.0000 May 1998.0000 June 1998.0000 July 1998.0000 August 1998.0000 September 1998.0000 October 1998.0000 November 1998.0000 December 1998.0000 January 1998.0000 February 1998.0000 March 1998.0000 April 1998.0000 May 1998.0000 June 1998.0000 1998.0000 August 1998.0000 September 1998.0000 October 1998.0000 November 1998.0000 December 1998.0000 January 1998.0000 22.37 21.96 23.35 23.10 22.90 21.21 21.31 22.43 23.59 24.83 24.87 24.64 25.24 25.68 25.95 26.64 27.66 27.65 26.89 26.90 25.90 26.40 25.70 25.17 25.67 25.41 26.47 27.14 26.59 26.74 26.34 25.41 25.65 26.07 26.29 26.10 25.73 24.88 25.93 26.44 26.47 26.25 26.33 26.15 25.65 24.75 24.70 25.05 25.64 26.54 26.93 27.28 27.21 27.32 26.23 26.98 27.55 27.42 27.41 26.15 26.73 27.32 25.73 25.96 24.02 90 92 93 94 95 96 97 98 99 100 101 102 103 104 105 106 107 108 109 110 111 112 113 July 115 116 117 118 119 120 121 EEEEEEEEEE 121 122 123 124 125 126 127 128 129 130 132 133 134 135 136 137 138 139 140 141 142 143 144 145 146 147 148 149 150 151 152 153 154 155 January 1998.0000 24.02 February 1998.0000 23.50 March 1998.0000 22.61 April 1998.0000 23.36 May 1998.0000 23.70 June 1998.0000 22.42 July 1998.0000 20.91 August 1998.0000 21.40 September 1998.0000 20.36 October 1998.0000 16.39 November 1998.0000 15.26 December 1998.0000 15.38 January 1998.0000 15.17 February 1998.0000 14.12 March 1998.0000 13.32 April 1998.0000 14.98 May 1998.0000 16.00 June 1998.0000 16.38 July 1998.0000 16.69 August 1998.0000 18.09 September 1998.0000 18.83 October 1998.0000 19.36 November 1998.0000 19.81 December 1998.0000 20.32 January 1998.0000 20.53 February 1998.0000 19.92 March 1998.0000 21.00 April 1998.0000 21.80 May 1998.0000 20.48 June 1998.0000 19.74 July 1998.0000 19.67 August 1998.0000 19.77 September 1998.0000 20.38 October 1998.0000 21.24 November 1998.0000 21.70 December 1998.0000 22.40 January 1998.0000 22.98 February 1998.0000 23.49 March 1998.0000 22.90 April 1998.0000 23.14 May 1998.0000 23.06 June 1998.0000 22.10 July 1998.0000 22.61 August 1998.0000 20.05 September 1998.0000 19.70 October 1998.0000 20.16 November 1998.0000 20.35 December 1998.0000 20.52 January 1998.0000 21.21 February 1998.0000 21.80 March 1998.0000 22.05 April 1998.0000 21.78 May 1998.0000 20.94 June 1998.0000 20.55 July 1998.0000 21.00 August 1998.0000 21.41 September 1998.0000 21.78 October 1998.0000 21.58 November 1998.0000 20.90 December 1998.0000 21.24 January 1998.0000 21.90 February 1998.0000 22.05 March 1998.0000 22.42 April 1998.0000 22.60 May 1998.0000 23.41 156 157 158 159 160 161 162 163 164 165 166 167 168 169 170 171 172 173 174 175 176 177 178 179 180 181 182 183 184 185 185 186 187 188 189 190 191 192 193 194 195 196 197 198 199 200 201 202 203 2044 203 206 207 208 209 May 1998.0000 June 1998.0000 July 1998.0000 August 1998.0000 September 1998.0000 October 1998.0000 November 1998.0000 December 1998.0000 January 1998.0000 February 1998.0000 March 1998.0000 April 1998.0000 May 1998.0000 June 1998.0000 July 1998.0000 August 1998.0000 September 1998.0000 October 1998.0000 November 1998.0000 December 1998.0000 January 1998.0000 February 1998.0000 March 1998.0000 April 1998.0000 May 1998.0000 June 1998.0000 July 1998.0000 August 1998.0000 September 1998.0000 October 1998.0000 November 1998.0000 December 1998.0000 January 1998.0000 February 1998.0000 March 1998.0000 April 1998.0000 May 1998.0000 1998.0000 July 1998.0000 August 1998.0000 September 1998.0000 October 1998.0000 November 1998.0000 December 1998.0000 January 1998.0000 February 1998.0000 March 1998.0000 April 1998.0000 May 1998.0000 June 1998.0000 July 1998.0000 August 1998.0000 September 1998.0000 October 1998.0000 November 1998.0000 December 1998.0000 January 1998.0000 February 1998.0000 March 1998.0000 April 1998.0000 May 1998.0000 June 1998.0000 July 1998.0000 August 1998.0000 September 1998.0000 210 211 21Z 213 214 215 216 217 218 219 220 221 222 223 224 225 226 227 228 229 230 231 232 233 234 235 236 237 238 239 240 241 242 243 244 245 246 247 248 23.41 22.93 23.49 23.36 23.44 23.83 24.64 24.86 24.86 24.59 24.96 24.79 24.94 25.56 25.82 25.62 25.92 25.16 26.61 26.79 26.49 27.00 26.7 26.79 26.81 26.50 26.38 25.69 24.50 25.49 26.23 25.97 24.21 24.00 25.37 25.92 25.69 25.84 26.69 26.95 26.73 26.53 26.85 27.87 28.06 28.66 29.09 28.90 29.31 29.75 30.00 29.91 30.17 30.92 31.30 32.09 33.31 32.04 31.81 30.97 31.24 31.63 31.89 32.39 32.62 June 249 249 250 251 252 253 254 255 256 257 25 259 260 261 262 263 264 265 266 267 268 269 270 271 272 273 274 275 274 277 278 279 280 281 282 283 284 285 286 287 288 289 290 September 1998.0000 October 1998.0000 November 1998.0000 December 1998.0000 January 1998.0000 February 1998.0000 March 1998.0000 April 1998.0000 May 1998.0000 June 1998.0000 July 1998.0000 August 1998.0000 September 1998.0000 October 1998.0000 November 1998.0000 December 1998.0000 January 1998.0000 February 1998.0000 March 1998.0000 April 1998.0000 May 1998.0000 June 1998.0000 July 1998.0000 August 1998.0000 September 1998.0000 October 1998.0000 November 1998.0000 December 1998.0000 January 1998.0000 February 1998.0000 March 1998.0000 April 1998.0000 May 1998.0000 June 1998.0000 July 1998.0000 August 1998.0000 September 1998.0000 October 1998.0000 November 1998.0000 December 1998.0000 January 1998.0000 February 1998.0000 32.62 31.04 30.20 28.29 28.38 29.54 29.58 30.13 29.24 29.28 29.99 28.71 29.23 28.84 29.84 30.33 30.99 30.73 24.82 25.93 27.33 28.84 29.60 31.16 30.84 31.28 32.47 33.77 34.51 35.10 35.04 36.72 36.55 36.70 37.44 37.97 37.62 37.25 38.75 38.66 37.73 37.79 Exce! checks CAPE Excel checks average summation variance standard deviation 24 years 2 months Shiller P/E V CAPE 0.0833 Date sorted Raw Data Shiller P/E frequency value Number Bins per interval percent start points y - mean ly. mean) Z score CORPORATE FINANCE & ACCOUNTING FINANCIAL RATIOS CAPE Ratio Definition sercent https://www.lynalden.com/shiller-pe-cape-ratio/ http://www.econ.yale.edu/-shiller/data.htm 1 2 3 4 1 2 3 5 6 7 5 6 7 8 9 What is the CAPE Ratio? The CAPE ratio is a valuation measure that uses real earnings per share (EPS) over a 10-year period to smooth out fluctuations in corporate profits that occur over different periods of a business cycle. The CAPE ratio, using the acronym for cyclically adjusted price-to-earnings ratio, was popularized by Yale University professor Robert Shiller. It is also known as the Shiller P/E ratio. The P/E ratio is a valuation metric that measures a stock's price relative to the company's earnings per share. EPS is a company's profit divided by the outstanding equity shares. 8 9 9 10 11 12 13 14 15 16 17 10 11 12 13 14 15 16 17 18 [12 - 13.5) [13.5 - 15) 15 - 16.5) (16.5 -18) [18-19.5) [19.5-21) [21-22.5) [22.5-24) [24-25.5) [25.5 -27) [27-28.5) [28.5 - 30) (30-31.5) (31.5 - 33) [33 - 34.5) (34.5 - 36) 36 - 37.5) 37.5 - 39) [39 - 40.5) [40.5 - 42) [42-43.5) [43.5 - 45) [45 - 46.5) total The ratio is generally applied to broad equity indices to assess whether the market is undervalued or overvalued. While the CAPE ratio is a popular and widely-followed measure, several leading industry practitioners have called into question its utility as a predictor of future stock market returns 18 19 20 21 22 23 24 25 26 19 20 21 22 23 The Formula for the CAPE Ratio is: CAPE Ratio - Share Price 10-year average, inflation - adjusted earnings 27 Z-ly-ybar) / S 28 29 January 1998.0000 32.86 February 1998.0000 34.71 March 1998.0000 36.30 April 1998.0000 37.28 May 1998.0000 36.96 June 1998.0000 36.80 July 1998.0000 38.26 August 1998.0000 35.42 September 1998.0000 33.53 October 1998.0000 33.77 November 1998.0000 37.37 December 1998.0000 38.82 January 1998.0000 40.58 February 1998.0000 40.40 March 1998.0000 41.36 April 1998.0000 42.70 May 1998.0000 42.56 June 1998.0000 42.18 July 1998.0000 43.83 August 1998.0000 41.93 September 1998.0000 41.32 October 1998.0000 40.55 November 1998.0000 43.21 December 1998.0000 44.20 January 1998.0000 43.77 February 1998.0000 42.19 March 1998.0000 43.22 April 1998.0000 43.53 May 1998.0000 41.97 June 1998.0000 July 1998.0000 42.76 August 1998.0000 42.87 September 1998.0000 41.90 October 1998.0000 39.37 November 1998.0000 38.78 December 1998.0000 37.27 January 1998.0000 36.98 February 1998.0000 35.83 March 1998.0000 32.33 April 1998.0000 32.17 May 1998.0000 34.07 June 1998.0000 33.07 July 1998.0000 32.16 August 1998.0000 31.40 September 1998.0000 27.67 October 1998.0000 28.58 November 1998.0000 30.01 December 1998.0000 30.50 January 1998.0000 30.28 February 1998.0000 29.09 March 1998.0000 30.29 April 1998.0000 29.01 May 1998.0000 28.13 June 1998.0000 26.39 July 1998.0000 23.46 August 1998.0000 23.59 September 1998.0000 22.37 42.78 What Does the CAPE Ratio Tell You? A company's profitability is determined to a significant extent by various economic cycle influences. During expansions, profits rise substantially as consumers spend more money, but during recessions, consumers buy less, profits plunge, and can turn into losses. While profit swings are much larger for companies in cyclical sectors such as commodities and financials-than they are for firms in defensive sectors such as utilities and pharmaceuticals, few companies can maintain steadfast profitability in the face of a deep recession. Z score start points 30 31 32 33 34 Z score value Bins frequency Number per interval percent 1 2 3 35 36 37 38 4 39 Because volatility in per-share eamings also results in price-earnings (P/E) ratios that bounce around significantly Benjamin Graham and David Dodd recommended in their seminal 1934 book, Security Analysis, that for examining valuation ratios, one should use an average of earnings over preferably seven or ten years. 40 5 6 6 7 8 9 10 1. The CAPE ratio is used to analyze a publicly held company's long-term financial performance while considering the impact of different economic cycles on the company's earnings. 2. The CAPE ratio is similar to the price-to-earnings ratio and is used to determine whether a stock is over-or under-valued. 3. The ratio considers the impact of economic influences by comparing a stock price to average earnings, adjusted for inflation, over a 10-year period 42 43 44 45 46 47 48 11 12 13 14 15 [-2.4 -2.2) -2.2 - 2.0) [-2.0.1.8) -1.8.-1.6) [-1.6 -1.4) [-1.4-1.2) [-1.2..1.0) [-1.0.0.8) -0.8 -0.6) -0.6 -0.4) -0.4 - -0.2) (-0.20) [O- 0.2) 10.2 - 0.4) 0.4-0.6) 0.6 - 0.8) [0.8 - 1.0) 1.0 - 1.2) (1.2 - 1.4) [1.4 - 1.6) (1.6 - 1.8) (1.8 - 2.0) [2.0 - 2.2) [2.2 - 2.4) 16 17 18 49 50 51 52 53 54 55 56 57 19 20 21 22 23 24 57 24 25 [2.2 - 2.4) [2.4 - 2.6) total 58 59 60 61 62 CAPE July 0.0000 average 64 65 66 67 68 69 70 71 72 73 74 75 76 77 78 79 80 81 0.0000 standard deviation 0.00 variance 82 83 84 85 86 87 88 89 September 1998.0000 October 1998.0000 November 1998.0000 December 1998.0000 January 1998.0000 February 1998.0000 March 1998.0000 April 1998.0000 May 1998.0000 June 1998.0000 1998.0000 August 1998.0000 September 1998.0000 October 1998.0000 November 1998.0000 December 1998.0000 January 1998.0000 February 1998.0000 March 1998.0000 April 1998.0000 May 1998.0000 June 1998.0000 July 1998.0000 August 1998.0000 September 1998.0000 October 1998.0000 November 1998.0000 December 1998.0000 January 1998.0000 February 1998.0000 March 1998.0000 April 1998.0000 May 1998.0000 June 1998.0000 July 1998.0000 August 1998.0000 September 1998.0000 October 1998.0000 November 1998.0000 December 1998.0000 January 1998.0000 February 1998.0000 March 1998.0000 April 1998.0000 May 1998.0000 June 1998.0000 July 1998.0000 August 1998.0000 September 1998.0000 October 1998.0000 November 1998.0000 December 1998.0000 January 1998.0000 February 1998.0000 March 1998.0000 April 1998.0000 May 1998.0000 June 1998.0000 1998.0000 August 1998.0000 September 1998.0000 October 1998.0000 November 1998.0000 December 1998.0000 January 1998.0000 22.37 21.96 23.35 23.10 22.90 21.21 21.31 22.43 23.59 24.83 24.87 24.64 25.24 25.68 25.95 26.64 27.66 27.65 26.89 26.90 25.90 26.40 25.70 25.17 25.67 25.41 26.47 27.14 26.59 26.74 26.34 25.41 25.65 26.07 26.29 26.10 25.73 24.88 25.93 26.44 26.47 26.25 26.33 26.15 25.65 24.75 24.70 25.05 25.64 26.54 26.93 27.28 27.21 27.32 26.23 26.98 27.55 27.42 27.41 26.15 26.73 27.32 25.73 25.96 24.02 90 92 93 94 95 96 97 98 99 100 101 102 103 104 105 106 107 108 109 110 111 112 113 July 115 116 117 118 119 120 121 EEEEEEEEEE 121 122 123 124 125 126 127 128 129 130 132 133 134 135 136 137 138 139 140 141 142 143 144 145 146 147 148 149 150 151 152 153 154 155 January 1998.0000 24.02 February 1998.0000 23.50 March 1998.0000 22.61 April 1998.0000 23.36 May 1998.0000 23.70 June 1998.0000 22.42 July 1998.0000 20.91 August 1998.0000 21.40 September 1998.0000 20.36 October 1998.0000 16.39 November 1998.0000 15.26 December 1998.0000 15.38 January 1998.0000 15.17 February 1998.0000 14.12 March 1998.0000 13.32 April 1998.0000 14.98 May 1998.0000 16.00 June 1998.0000 16.38 July 1998.0000 16.69 August 1998.0000 18.09 September 1998.0000 18.83 October 1998.0000 19.36 November 1998.0000 19.81 December 1998.0000 20.32 January 1998.0000 20.53 February 1998.0000 19.92 March 1998.0000 21.00 April 1998.0000 21.80 May 1998.0000 20.48 June 1998.0000 19.74 July 1998.0000 19.67 August 1998.0000 19.77 September 1998.0000 20.38 October 1998.0000 21.24 November 1998.0000 21.70 December 1998.0000 22.40 January 1998.0000 22.98 February 1998.0000 23.49 March 1998.0000 22.90 April 1998.0000 23.14 May 1998.0000 23.06 June 1998.0000 22.10 July 1998.0000 22.61 August 1998.0000 20.05 September 1998.0000 19.70 October 1998.0000 20.16 November 1998.0000 20.35 December 1998.0000 20.52 January 1998.0000 21.21 February 1998.0000 21.80 March 1998.0000 22.05 April 1998.0000 21.78 May 1998.0000 20.94 June 1998.0000 20.55 July 1998.0000 21.00 August 1998.0000 21.41 September 1998.0000 21.78 October 1998.0000 21.58 November 1998.0000 20.90 December 1998.0000 21.24 January 1998.0000 21.90 February 1998.0000 22.05 March 1998.0000 22.42 April 1998.0000 22.60 May 1998.0000 23.41 156 157 158 159 160 161 162 163 164 165 166 167 168 169 170 171 172 173 174 175 176 177 178 179 180 181 182 183 184 185 185 186 187 188 189 190 191 192 193 194 195 196 197 198 199 200 201 202 203 2044 203 206 207 208 209 May 1998.0000 June 1998.0000 July 1998.0000 August 1998.0000 September 1998.0000 October 1998.0000 November 1998.0000 December 1998.0000 January 1998.0000 February 1998.0000 March 1998.0000 April 1998.0000 May 1998.0000 June 1998.0000 July 1998.0000 August 1998.0000 September 1998.0000 October 1998.0000 November 1998.0000 December 1998.0000 January 1998.0000 February 1998.0000 March 1998.0000 April 1998.0000 May 1998.0000 June 1998.0000 July 1998.0000 August 1998.0000 September 1998.0000 October 1998.0000 November 1998.0000 December 1998.0000 January 1998.0000 February 1998.0000 March 1998.0000 April 1998.0000 May 1998.0000 1998.0000 July 1998.0000 August 1998.0000 September 1998.0000 October 1998.0000 November 1998.0000 December 1998.0000 January 1998.0000 February 1998.0000 March 1998.0000 April 1998.0000 May 1998.0000 June 1998.0000 July 1998.0000 August 1998.0000 September 1998.0000 October 1998.0000 November 1998.0000 December 1998.0000 January 1998.0000 February 1998.0000 March 1998.0000 April 1998.0000 May 1998.0000 June 1998.0000 July 1998.0000 August 1998.0000 September 1998.0000 210 211 21Z 213 214 215 216 217 218 219 220 221 222 223 224 225 226 227 228 229 230 231 232 233 234 235 236 237 238 239 240 241 242 243 244 245 246 247 248 23.41 22.93 23.49 23.36 23.44 23.83 24.64 24.86 24.86 24.59 24.96 24.79 24.94 25.56 25.82 25.62 25.92 25.16 26.61 26.79 26.49 27.00 26.7 26.79 26.81 26.50 26.38 25.69 24.50 25.49 26.23 25.97 24.21 24.00 25.37 25.92 25.69 25.84 26.69 26.95 26.73 26.53 26.85 27.87 28.06 28.66 29.09 28.90 29.31 29.75 30.00 29.91 30.17 30.92 31.30 32.09 33.31 32.04 31.81 30.97 31.24 31.63 31.89 32.39 32.62 June 249 249 250 251 252 253 254 255 256 257 25 259 260 261 262 263 264 265 266 267 268 269 270 271 272 273 274 275 274 277 278 279 280 281 282 283 284 285 286 287 288 289 290 September 1998.0000 October 1998.0000 November 1998.0000 December 1998.0000 January 1998.0000 February 1998.0000 March 1998.0000 April 1998.0000 May 1998.0000 June 1998.0000 July 1998.0000 August 1998.0000 September 1998.0000 October 1998.0000 November 1998.0000 December 1998.0000 January 1998.0000 February 1998.0000 March 1998.0000 April 1998.0000 May 1998.0000 June 1998.0000 July 1998.0000 August 1998.0000 September 1998.0000 October 1998.0000 November 1998.0000 December 1998.0000 January 1998.0000 February 1998.0000 March 1998.0000 April 1998.0000 May 1998.0000 June 1998.0000 July 1998.0000 August 1998.0000 September 1998.0000 October 1998.0000 November 1998.0000 December 1998.0000 January 1998.0000 February 1998.0000 32.62 31.04 30.20 28.29 28.38 29.54 29.58 30.13 29.24 29.28 29.99 28.71 29.23 28.84 29.84 30.33 30.99 30.73 24.82 25.93 27.33 28.84 29.60 31.16 30.84 31.28 32.47 33.77 34.51 35.10 35.04 36.72 36.55 36.70 37.44 37.97 37.62 37.25 38.75 38.66 37.73 37.79 Exce! checks CAPE Excel checks average summation variance standard deviation


