Answered step by step
Verified Expert Solution
Question
1 Approved Answer
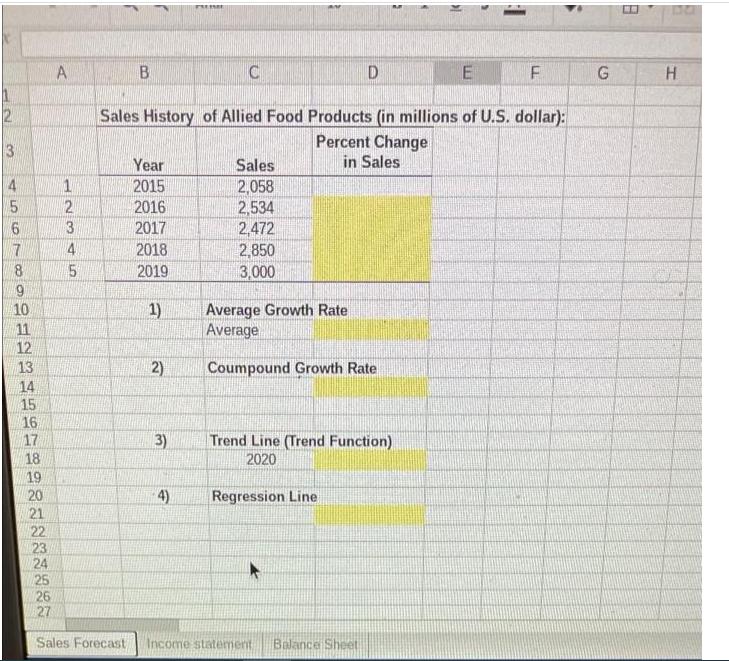
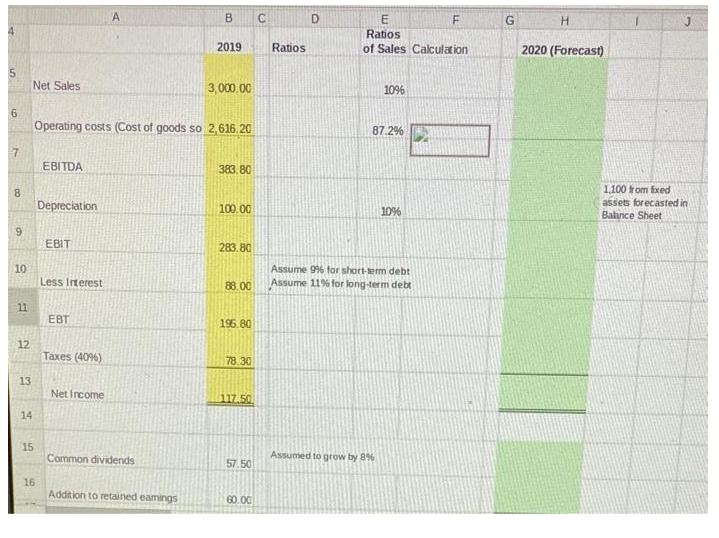
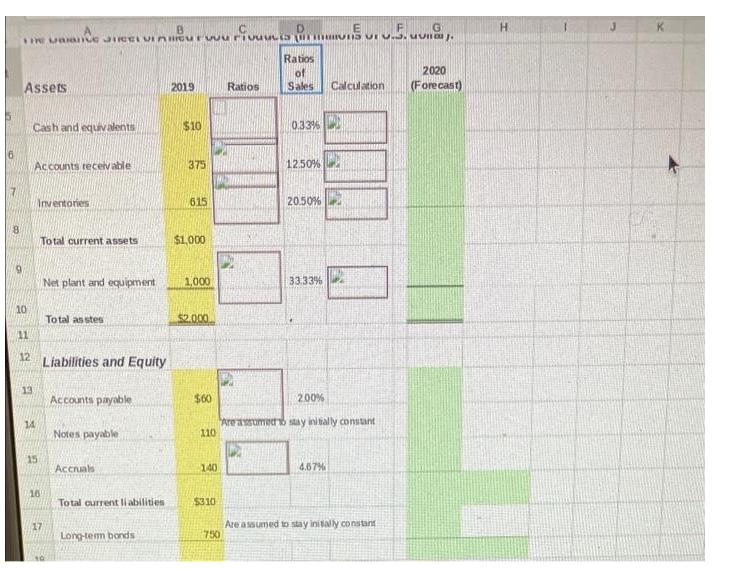
Fill in shaded area *Excel* 2 3 4 6771956 10 11 12 13 14 15 16 17 18 19 20 21 22 22427 23


Fill in shaded area *Excel* 2 3 4 6771956 10 11 12 13 14 15 16 17 18 19 20 21 22 22427 23 25 26 A 12345 B Year 2015 2016 2017 2018 2019 1) 2) Sales History of Allied Food Products (in millions of U.S. dollar): Percent Change in Sales 3) C 4) Sales 2,058 2,534 2,472 2,850 3,000 D Average Growth Rate Average Coumpound Growth Rate Trend Line (Trend Function) 2020 Regression Line Sales Forecast Income statement Balance Sheet E F G H 4 5 6 7 8 9 10 11 12 13 14 Net Sales 15 16 EBITDA Operating costs (Cost of goods so 2,616.20 Depreciation EBIT Less Interest EBT Taxes (4096) A Net Income Common dividends B C Addition to retained eamings 2019 3,000.00 383,80 100.00 283.80 88.00 196.80 78.30 117.50 57.50 60.00 Ratios D E Ratios of Sales Calculation 10% 87.2% Assumed to grow by 8% 10% Assume 996 for short-term debt Assume 11% for long-term debt F G H 2020 (Forecast) 1,100 from fixed assets forecasted in Balance Sheet 6 8 B THE MARIE JICELVIAUru 9 Assets 10 11 12 Cash and equivalents 13 Accounts receivable 14 Inventories 15 Total current assets 16 17 Net plant and equipment Total as stes Liabilities and Equity Accounts payable Notes payable Accruals Total current li abilities Long-term bonds 2019 $10 375 615 $1,000 1,000 vu rivuutis EUFG rivuucis n5 ... $2.000 INT $60 110 140 $310 Ratios EN 750 Ratios of Sales 0.33% 12.50% 20.50% 33.33% 2.00% Are assumed to stay initially constant Calculation 4.67% Are assumed to stay initially constant 2020 (Forecast) H
Step by Step Solution
★★★★★
3.42 Rating (149 Votes )
There are 3 Steps involved in it
Step: 1
The detailed ...
Get Instant Access to Expert-Tailored Solutions
See step-by-step solutions with expert insights and AI powered tools for academic success
Step: 2

Step: 3

Ace Your Homework with AI
Get the answers you need in no time with our AI-driven, step-by-step assistance
Get Started


