FILL IN THE BLANK #1a. RejectDo not rejectb. Is evidenceIs insufficient evidenceFILL IN THE BLANK #2 a. Is less thanIs equal toIs greater thanb. Is less thanIs equal toIs greater thanFILL IN THE BLANK #3 a. Reject Do not reject b. Is insufficient evidence Is evidence
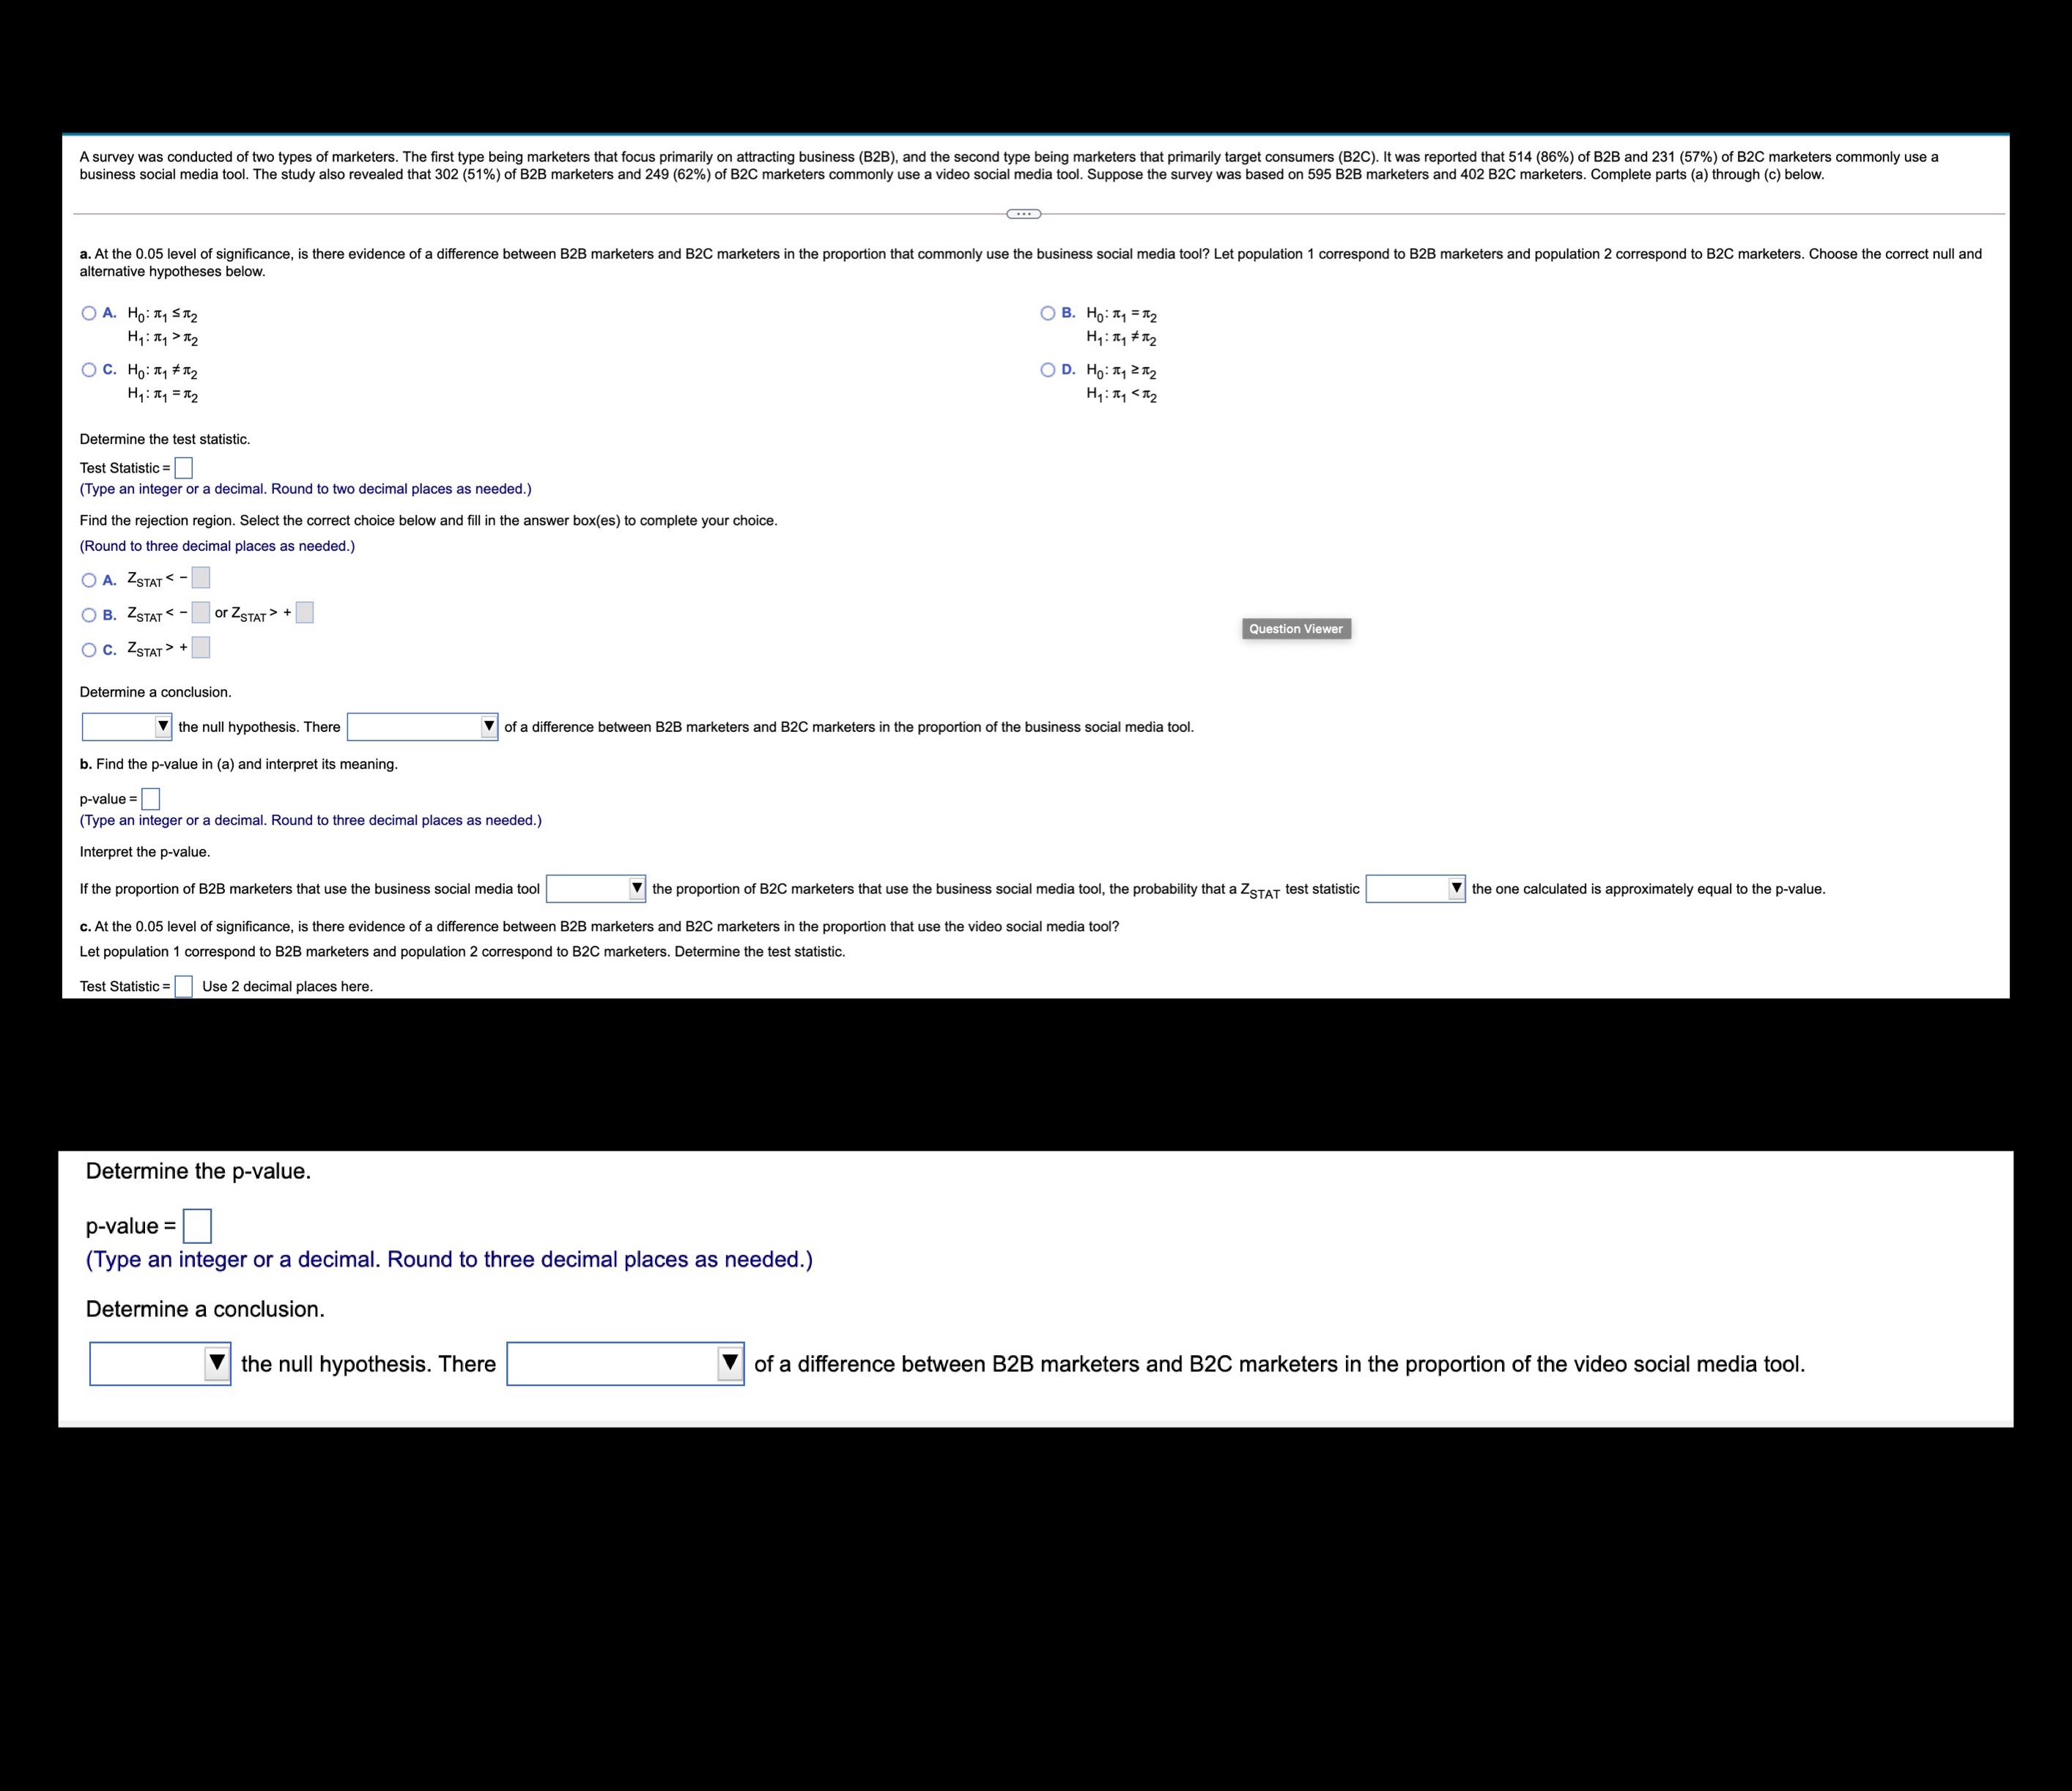
A survey was conducted of two types of marketers. The first type being marketers that focus primarily on attracting business (B2B), and the second type being marketers that primarily target consumers (B2C). It was reported that 514 (86%) of B2B and 231 (57%) of B2C marketers commonly use a business social media tool. The study also revealed that 302 (51%) of B2B marketers and 249 (62%) of B2C marketers commonly use a video social media tool. Suppose the survey was based on 595 B2B marketers and 402 B2C marketers. Complete parts (a) through (c) below. alternative hypotheses below. a. At the 0.05 level of significance, is there evidence of a difference between B2B marketers and B2C marketers in the proportion that commonly use the business social media tool? Let population 1 correspond to B2B marketers and population 2 correspond to B2C marketers. Choose the correct null and O A. HO: T1 ST2 O B. HO: T1 = 2 H 1 : 1 1 > 1 2 Hy : 141 # 14 2 O C. HO: my # 12 O D. HO: T1 2 12 Hy : 31 = 12 H: M + Question Viewer O C. ZSTAT > + Determine a conclusion . the null hypothesis . There of a difference between B2B marketers and B2C marketers in the proportion of the business social media tool. b. Find the p-value in (a) and interpret its meaning. p-value = (Type an integer or a decimal. Round to three decimal places as needed.) interpret the p-value. If the proportion of B2B marketers that use the busine cial media tool the proportion of B2C marketers cial media tool, the probability that a ZSTAT test statistic the one calculated is approximately equal to the p-value. C. At the 0.05 level of significance, is there evidence of a difference between B2B marketers and B2C marketers in the proportion that use the video social media tool? Let population 1 correspond to B2B marketers and population 2 correspond to B2C marketers. Determine the test statistic. Test Statistic = Use 2 decimal places here. Determine the p-value. p-value = (Type an integer or a decimal. Round to three decimal places as needed.) Determine a conclusion the null hypothesis. There of a difference between B2B marketers and B2C marketers in the proportion of the video social media tool