Answered step by step
Verified Expert Solution
Link Copied!

Question

1 Approved Answer

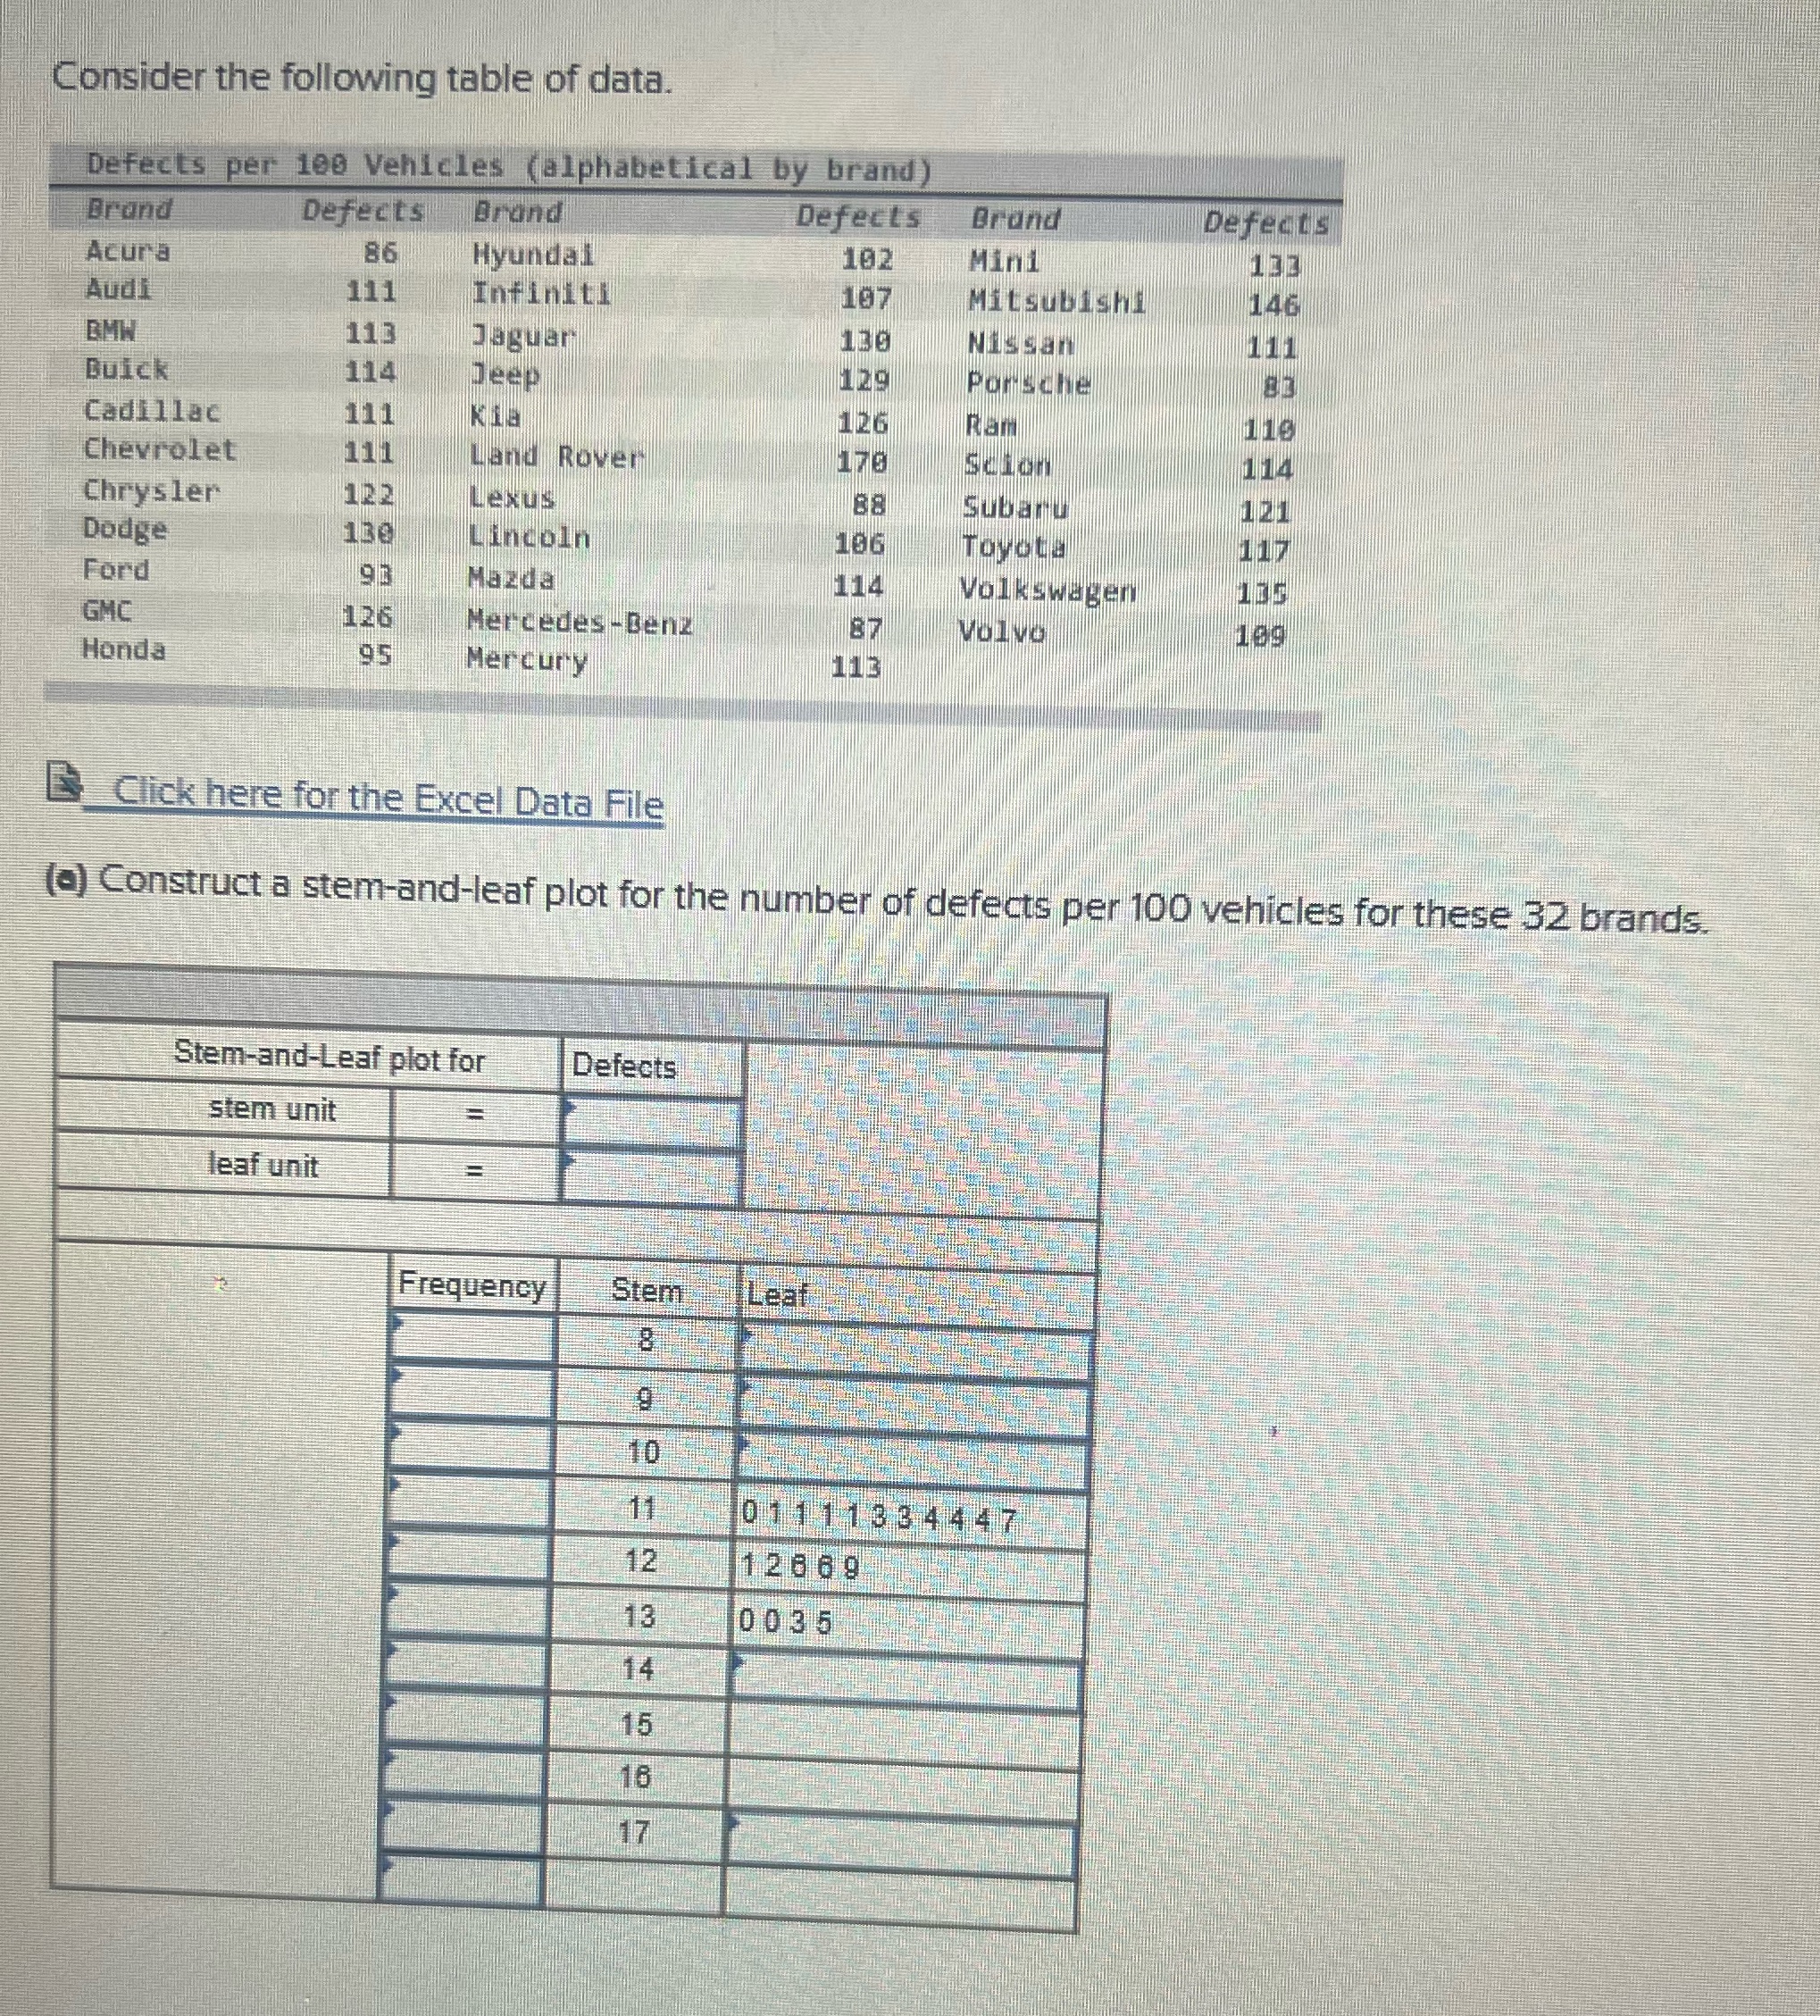
Fill in the blanks below Consider the following table of data. Defects per 100 Vehicles (alphabetical by brand) Brand Defects Brand Defects Brand Defects Acura

Fill in the blanks below

image text in transcribed
Consider the following table of data. Defects per 100 Vehicles (alphabetical by brand) Brand Defects Brand Defects Brand Defects Acura 86 Hyundal 102 Mini 133 Audi 111 Infiniti 187 Mitsubish 146 BMW 113 Jaguar 136 Nissan 101 Buick 114 Jeep 129 Porsche Cadillac 111 Kia 126 Ram Chevrolet 111 Land Rover 176 Scion 114 Chrysler 12 2 Lexus 88 Subaru 121 Dodge 136 Lincoln 106 Toyota 117 Ford 93 Mazda 114 Volkswagen GMC 126 Mercedes - Benz 87 Volvo Honda 95 Mercury 113 Click here for the Excel Data File ) Construct a stem-and-leaf plot for the number of defects per 100 vehicles for these 32 brands. Stem-and-Leaf plot for Defects stem unit leaf unit Frequency Stem 10 11 01111334447 12 126 69 13 0 035 14 15 16 17

Step by Step Solution

There are 3 Steps involved in it

Step: 1

blur-text-image

Get Instant Access to Expert-Tailored Solutions

See step-by-step solutions with expert insights and AI powered tools for academic success

Step: 2

blur-text-image

Step: 3

blur-text-image

Ace Your Homework with AI

Get the answers you need in no time with our AI-driven, step-by-step assistance

Get Started

Recommended Textbook for

A First Course in General Relativity

Authors: Bernard Schutz

2nd edition

521887054, 978-0521887052

More Books