

Answered step by step
Verified Expert Solution
Question
1 Approved Answer
fill in the blanks Estimated Fixed Cost Production costs: Direct materials. Direct labor... Factory overhead $ 350,000 Selling expenses: Sales salaries and commissions... 340,000 Advertising
fill in the blanks 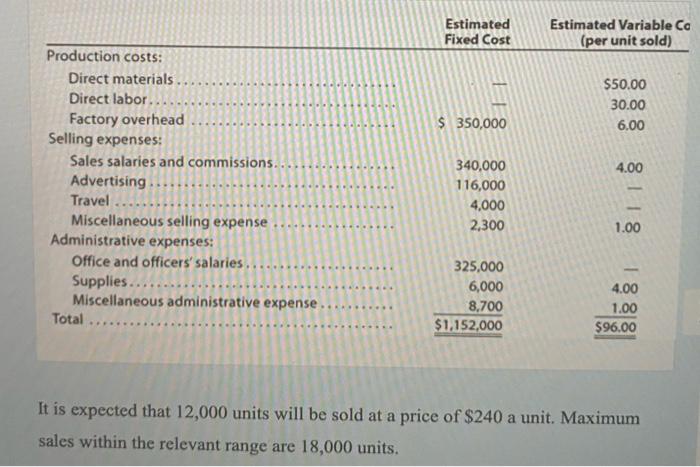
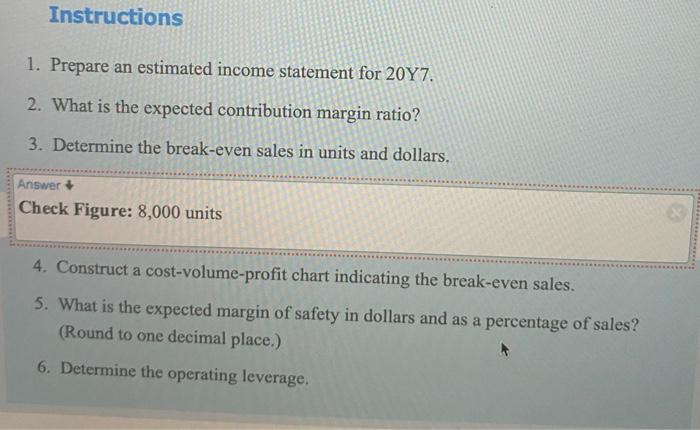
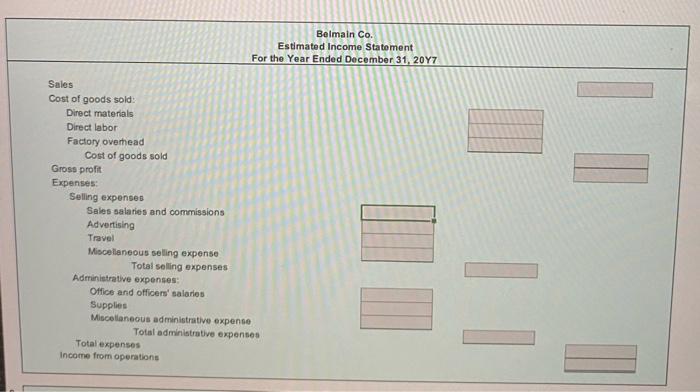
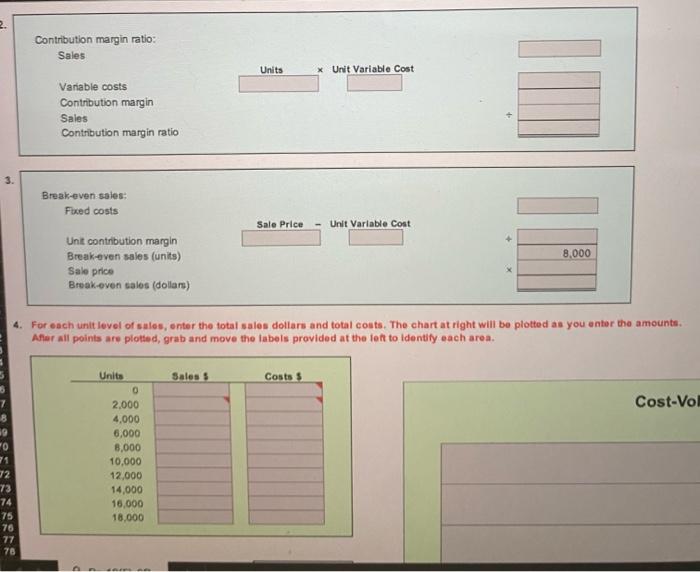
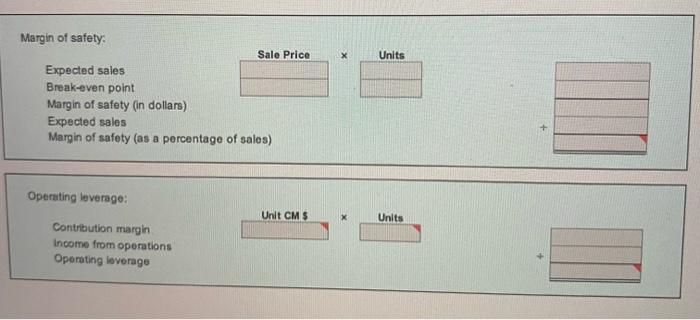
Estimated Fixed Cost Production costs: Direct materials. Direct labor... Factory overhead $ 350,000 Selling expenses: Sales salaries and commissions... 340,000 Advertising 116,000 Travel 4,000 Miscellaneous selling expense 2,300 1.00 Office and officers' salaries... 325,000 Supplies..... 6,000 4.00 Miscellaneous administrative expense Total 8,700 1.00 $1,152,000 $96.00 It is expected that 12,000 units will be sold at a price of $240 a unit. Maximum sales within the relevant range are 18,000 units. Administrative expenses: Estimated Variable Co (per unit sold) $50.00 30.00 6.00 4.00 ll Instructions 1. Prepare an estimated income statement for 20Y7. 2. What is the expected contribution margin ratio? 3. Determine the break-even sales in units and dollars. Answer + Check Figure: 8,000 units 4. Construct a cost-volume-profit chart indicating the break-even sales. 5. What is the expected margin of safety in dollars and as a percentage of sales? (Round to one decimal place.) 6. Determine the operating leverage. Sales Cost of goods sold: Direct materials Direct labor Factory overhead Cost of goods sold Sales salaries and commissions Advertising Travel Miscellaneous selling expense Total selling expenses Office and officers' salaries Supplies Miscellaneous administrative expense Total administrative expenses Total expenses Income from operations Gross profit Expenses: Selling expenses Belmain Co. Estimated Income Statement For the Year Ended December 31, 2017 Administrative expenses: Contribution margin ratio: Sales Units x Unit Variable Cost Variable costs Contribution margin Sales Contribution margin ratio Break-even sales: Fixed costs Sale Price Unit Variable Cost Unit contribution margin Break-even sales (units) 8,000 Sale price Break-even sales (dollars) 4. For each unit level of sales, enter the total sales dollars and total costs. The chart at right will be plotted as you enter the amounts. After all points are plotted, grab and move the labels provided at the left to identify each area. Units Sales S Costs $ Cost-Vol "O 72 73 74 75 76 77 78 0 2,000 4,000 6,000 8,000 10,000 12,000 14,000 16,000 18,000 0 2,000 4,000 6,000 Cost-Volume-Profit Chart $- 8,000 10,000 12,000 14,000 16,000 18,000 Units $1 $1 $1 co $1 $0 $0 Sales and Costs --Sales $ -Costs $ Margin of safety: Sale Price Expected sales Break-even point Margin of safety (in dollars) Expected sales Margin of safety (as a percentage of sales) Operating leverage: Contribution margin. Income from operations Operating leverage Unit CM $ X Units Units Step by Step Solution
There are 3 Steps involved in it
Step: 1

Get Instant Access to Expert-Tailored Solutions
See step-by-step solutions with expert insights and AI powered tools for academic success
Step: 2

Step: 3
Ace Your Homework with AI
Get the answers you need in no time with our AI-driven, step-by-step assistance
Get Started
International Accounting
Authors: Radebaugh
4th Edition
0471136646, 9780471136644