Answered step by step
Verified Expert Solution
Question
1 Approved Answer
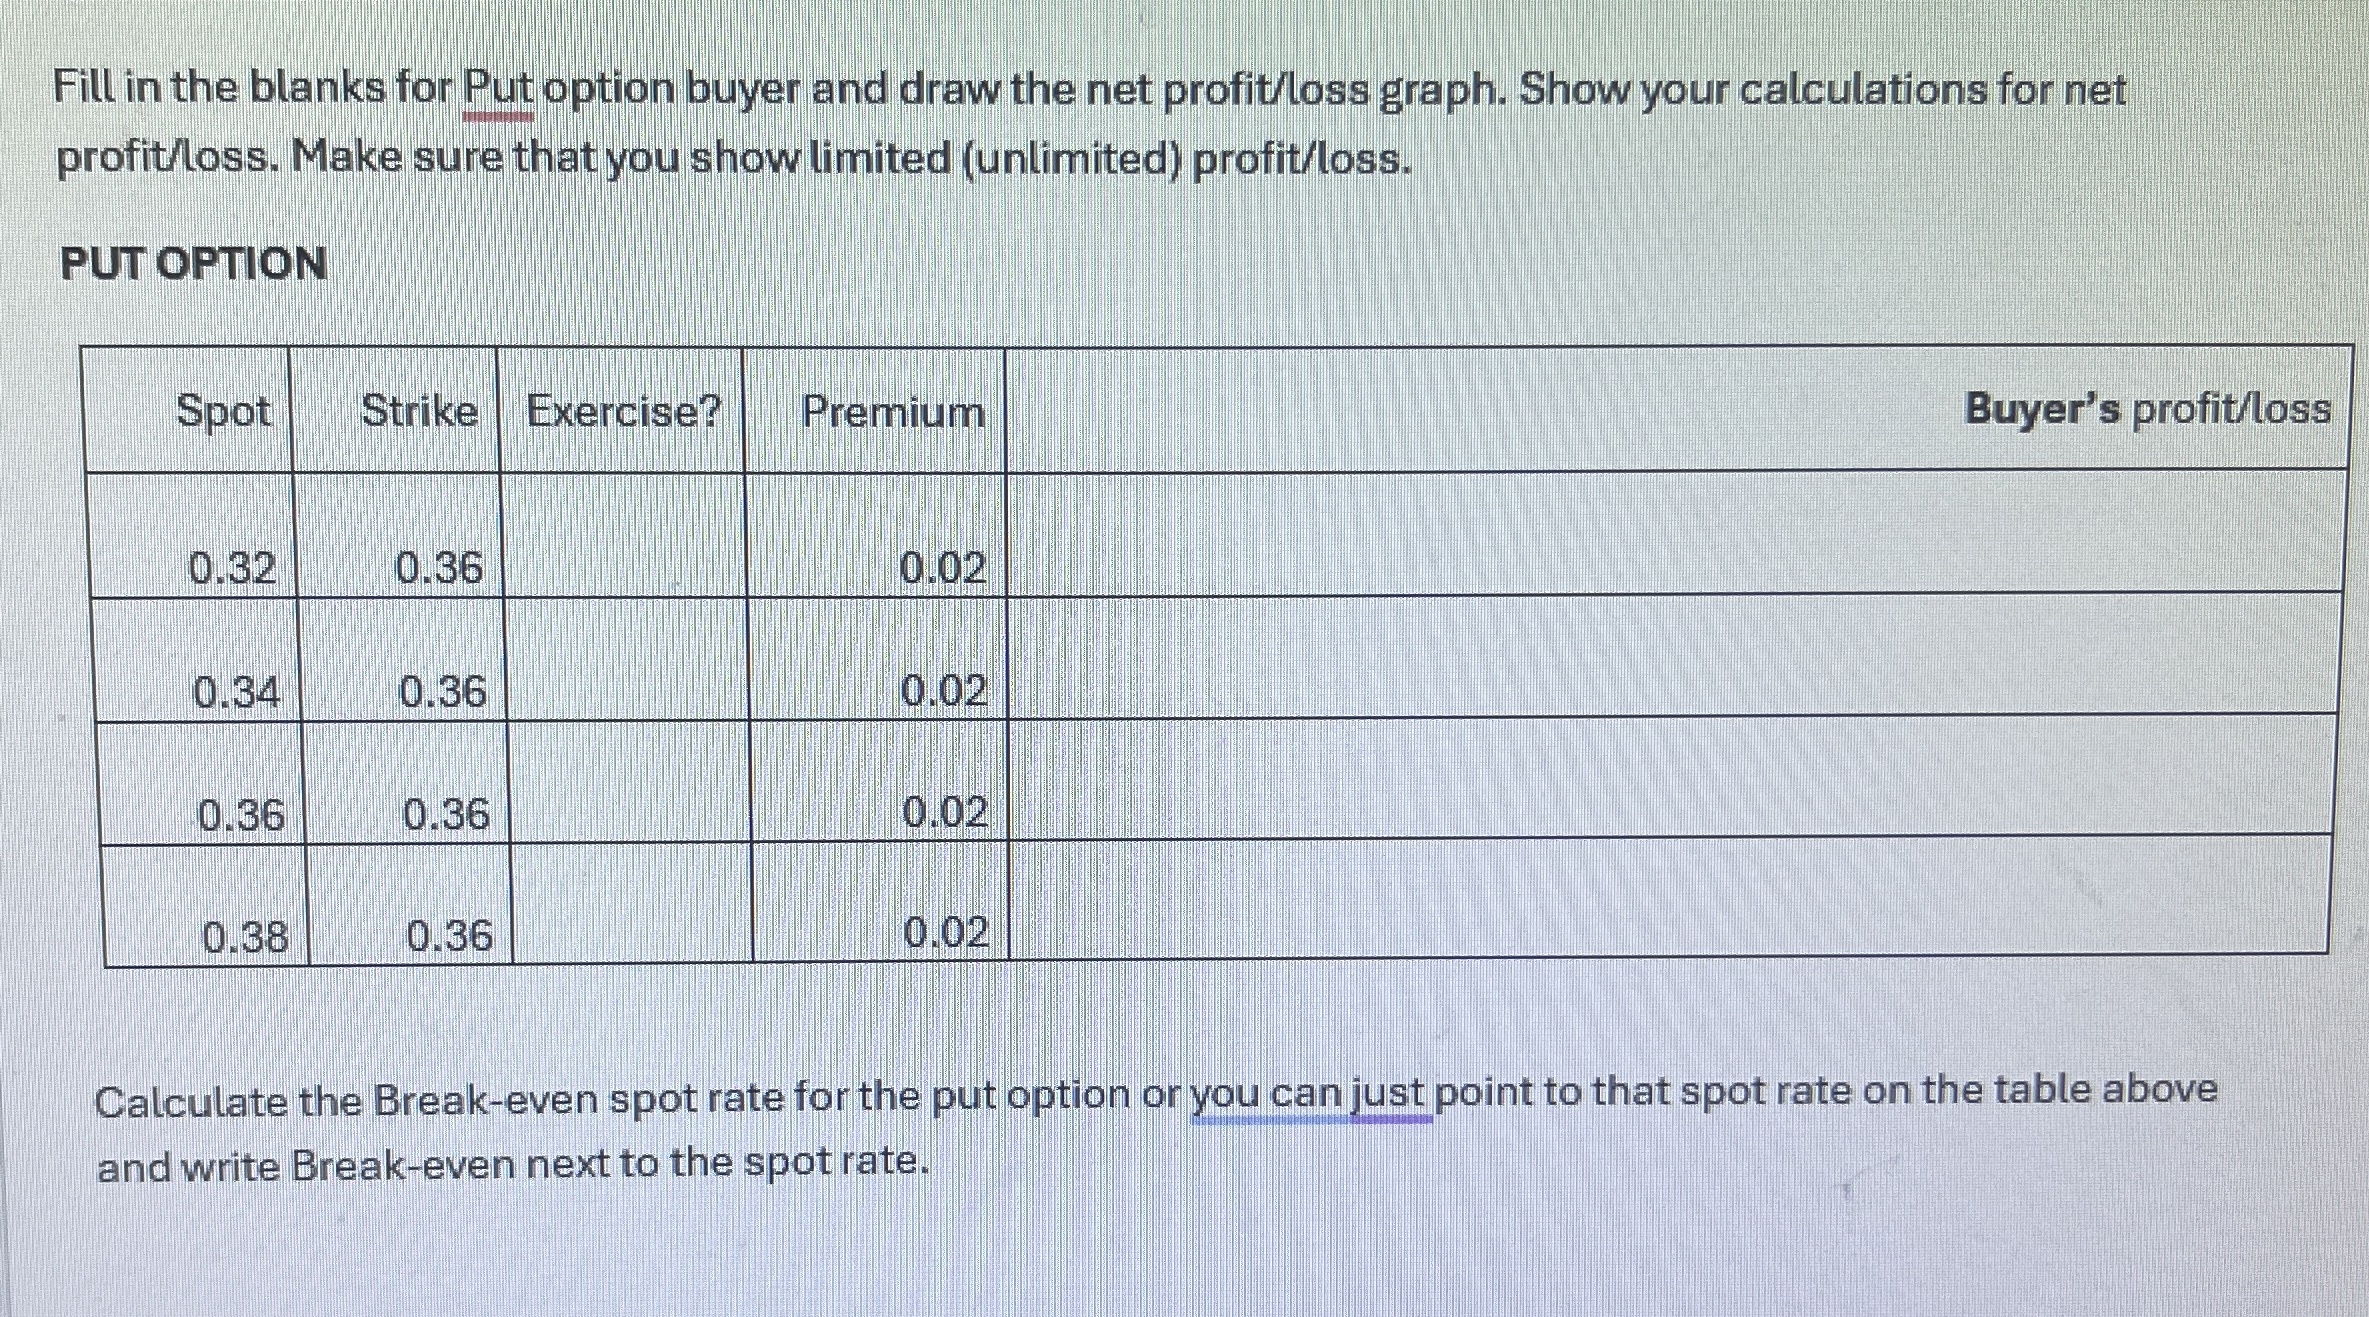
Fill in the blanks for Put option buyer and draw the net profit / loss graph. Show your calculations for net profit / loss .
Fill in the blanks for Put option buyer and draw the net profitloss graph. Show your calculations for net profitloss Make sure that you show limited unlimited profitloss
PUT OPTION
tableSpotStrike,Exercise?,Premium,
Calculate the Breakeven spot rate for the put option or you can just point to that spot rate on the table above and write Breakeven next to the spot rate.

Step by Step Solution
There are 3 Steps involved in it
Step: 1

Get Instant Access to Expert-Tailored Solutions
See step-by-step solutions with expert insights and AI powered tools for academic success
Step: 2

Step: 3

Ace Your Homework with AI
Get the answers you need in no time with our AI-driven, step-by-step assistance
Get Started


