

Answered step by step
Verified Expert Solution
Question
1 Approved Answer
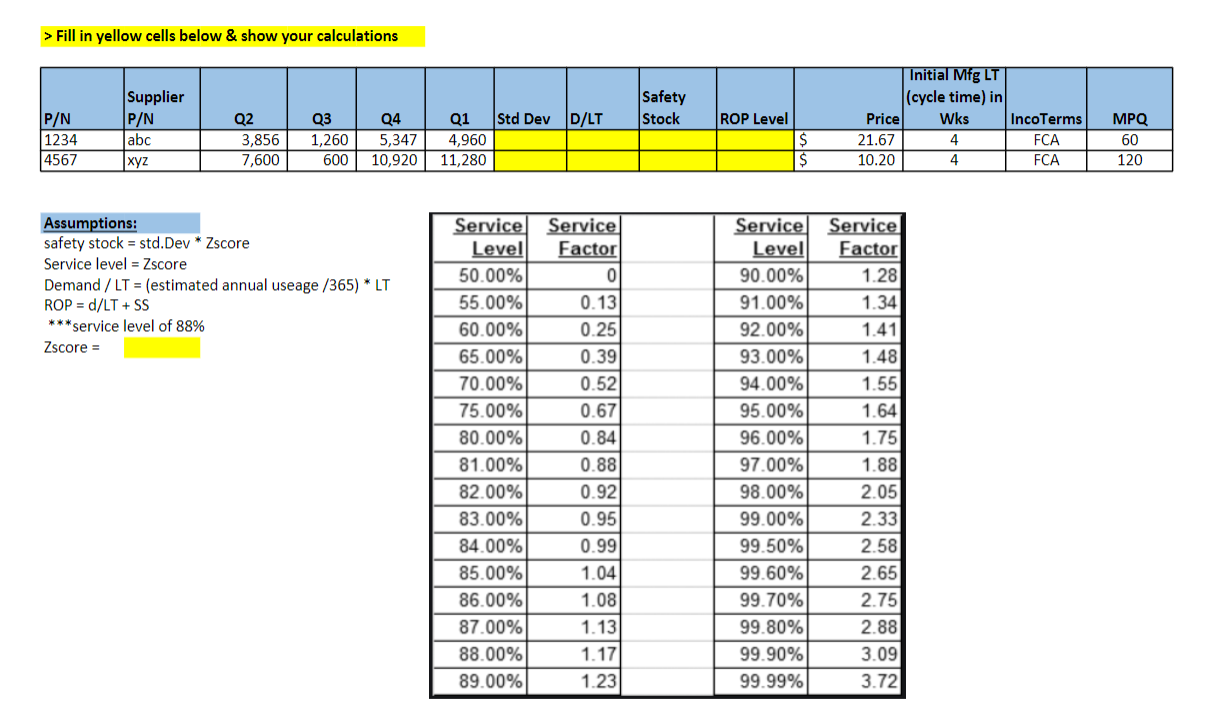
> Fill in yellow cells below & show your calculations Safety Stock ROP Level P/N 1234 4567 Supplier P/N abc 2 Q2 3,856 7,600 Q3
Step by Step Solution
There are 3 Steps involved in it
Step: 1

Get Instant Access to Expert-Tailored Solutions
See step-by-step solutions with expert insights and AI powered tools for academic success
Step: 2

Step: 3
Ace Your Homework with AI
Get the answers you need in no time with our AI-driven, step-by-step assistance
Get Started
Liars Poker Rising Through The Wreckage On Wall Street
Authors: Michael Lewis
1st Edition
0393246108,0393247147