Fill Out The Blank
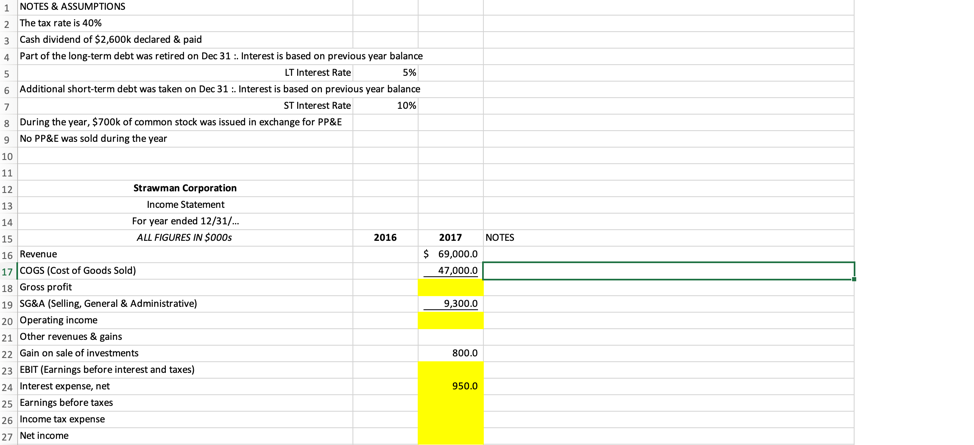
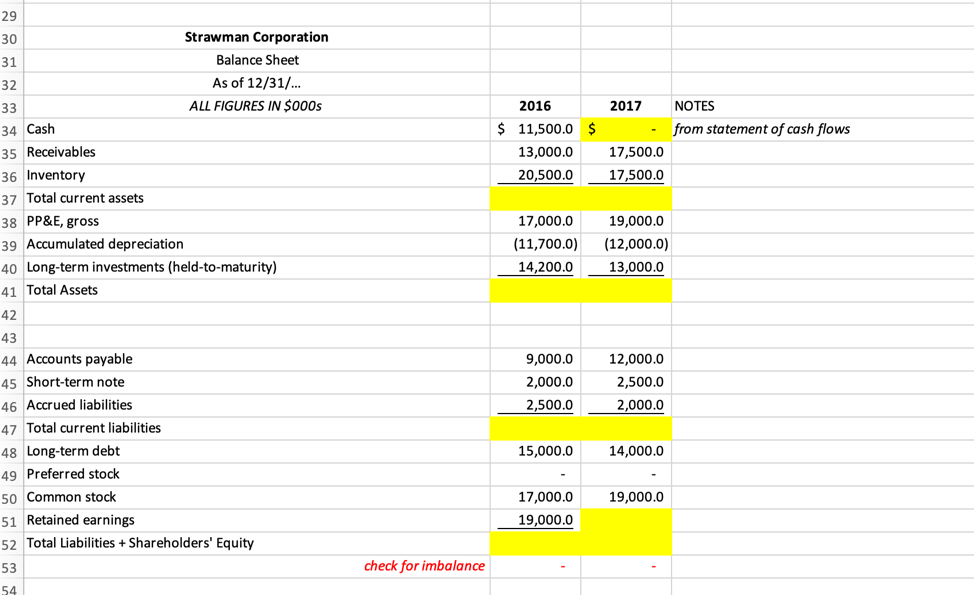
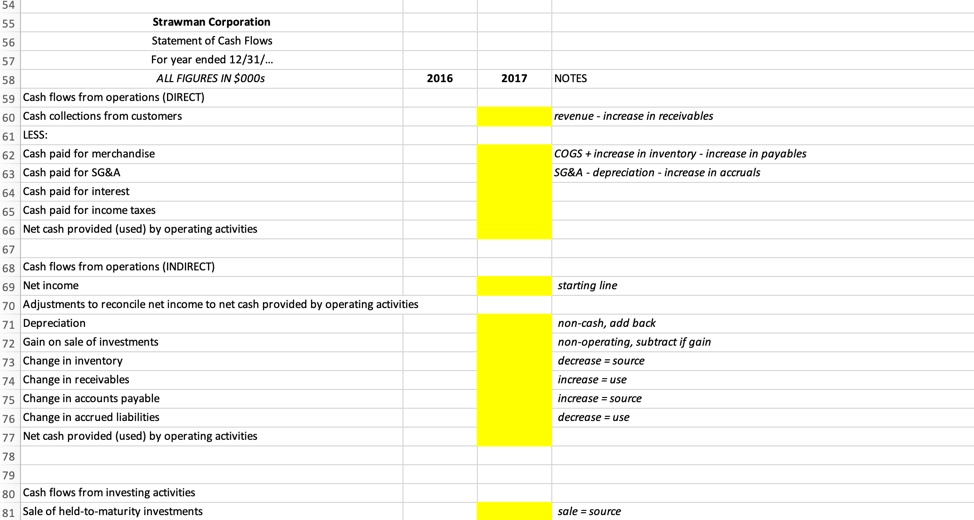
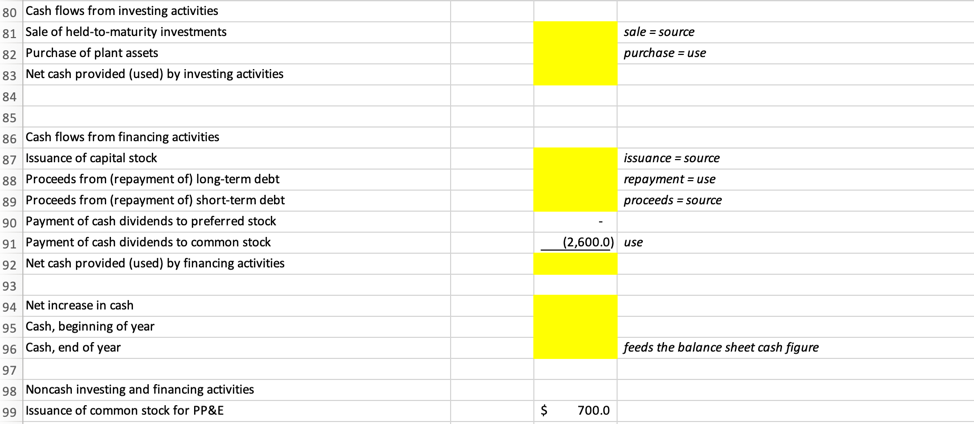
1 NOTES & ASSUMPTIONS 2 The tax rate is 40% 3 Cash dividend of $2,600k declared & paid 4 Part of the long-term debt was retired on Dec 31 : Interest is based on previous year balance LT Interest Rate 5% 6 Additional short-term debt was taken on Dec 31 : Interest is based on previous year balance ST Interest Rate 10% 8 During the year, $700k of common stock was issued in exchange for PP&E 9 No PP&E was sold during the year 2016 NOTES 2017 $ 69,000.0 47,000.0 9,300.0 Strawman Corporation Income Statement For year ended 12/31/... ALL FIGURES IN $000s 16 Revenue 17 COGS (Cost of Goods Sold) 18 Gross profit 19 SG&A (Selling, General & Administrative) 20 Operating income 21 Other revenues & gains 22 Gain on sale of investments 23 EBIT (Earnings before interest and taxes) 24 Interest expense, net 25 Earnings before taxes 26 Income tax expense 27 Net income 800.0 950.0 2017 NOTES from statement of cash flows $ 30 Strawman Corporation Balance Sheet As of 12/31/... ALL FIGURES IN $000s 34 Cash 35 Receivables 36 Inventory 37 Total current assets 38 PP&E, gross 39 Accumulated depreciation 40 Long-term investments (held-to-maturity) 41 Total Assets 2016 $ 11,500.0 13,000.0 20,500.0 17,500.0 17,500.0 17,000.0 (11,700.0) 14,200.0 19,000.0 (12,000.0) 13,000.0 9,000.0 2,000.0 2,500.0 12,000.0 2,500.0 2,000.0 44 Accounts payable 45 Short-term note 46 Accrued liabilities 47 Total current liabilities 48 Long-term debt 49 Preferred stock 50 Common stock 51 Retained earnings 52 Total Liabilities + Shareholders' Equity 15,000.0 14,000.0 19,000.0 17,000.0 19,000.0 check for imbalance 2016 2017 NOTES revenue - increase in receivables Strawman Corporation Statement of Cash Flows For year ended 12/31/... ALL FIGURES IN $000s 59 Cash flows from operations (DIRECT) 60 Cash collections from customers 61 LESS: 62 Cash paid for merchandise 63 Cash paid for SG&A 64 Cash paid for interest 65 Cash paid for income taxes 66 Net cash provided (used) by operating activities COGS + increase in inventory - increase in payables SG&A - depreciation - increase in accruals starting line 68 Cash flows from operations (INDIRECT) 69 Net income 70 Adjustments to reconcile net income to net cash provided by operating activities 71 Depreciation 72 Gain on sale of investments 73 Change in inventory 74 Change in receivables 75 Change in accounts payable 76 Change in accrued liabilities 77 Net cash provided (used) by operating activities non-cash, add back non-operating, subtract if gain decrease = source increase = use increase = source decrease = use 79 80 Cash flows from investing activities 81 Sale of held-to-maturity investments sale = source 80 Cash flows from investing activities 81 Sale of held-to-maturity investments 82 Purchase of plant assets 83 Net cash provided (used) by investing activities sale = source purchase = use 86 Cash flows from financing activities 87 Issuance of capital stock 88 Proceeds from (repayment of) long-term debt 89 Proceeds from (repayment of) short-term debt 90 Payment of cash dividends to preferred stock 91 Payment of cash dividends to common stock 92 Net cash provided (used) by financing activities issuance = source repayment = use proceeds = source (2,600.0) use 94 Net increase in cash 95 Cash, beginning of year 96 Cash, end of year feeds the balance sheet cash figure 97 98 Noncash investing and financing activities 99 Issuance of common stock for PP&E $ 700.0 1 NOTES & ASSUMPTIONS 2 The tax rate is 40% 3 Cash dividend of $2,600k declared & paid 4 Part of the long-term debt was retired on Dec 31 : Interest is based on previous year balance LT Interest Rate 5% 6 Additional short-term debt was taken on Dec 31 : Interest is based on previous year balance ST Interest Rate 10% 8 During the year, $700k of common stock was issued in exchange for PP&E 9 No PP&E was sold during the year 2016 NOTES 2017 $ 69,000.0 47,000.0 9,300.0 Strawman Corporation Income Statement For year ended 12/31/... ALL FIGURES IN $000s 16 Revenue 17 COGS (Cost of Goods Sold) 18 Gross profit 19 SG&A (Selling, General & Administrative) 20 Operating income 21 Other revenues & gains 22 Gain on sale of investments 23 EBIT (Earnings before interest and taxes) 24 Interest expense, net 25 Earnings before taxes 26 Income tax expense 27 Net income 800.0 950.0 2017 NOTES from statement of cash flows $ 30 Strawman Corporation Balance Sheet As of 12/31/... ALL FIGURES IN $000s 34 Cash 35 Receivables 36 Inventory 37 Total current assets 38 PP&E, gross 39 Accumulated depreciation 40 Long-term investments (held-to-maturity) 41 Total Assets 2016 $ 11,500.0 13,000.0 20,500.0 17,500.0 17,500.0 17,000.0 (11,700.0) 14,200.0 19,000.0 (12,000.0) 13,000.0 9,000.0 2,000.0 2,500.0 12,000.0 2,500.0 2,000.0 44 Accounts payable 45 Short-term note 46 Accrued liabilities 47 Total current liabilities 48 Long-term debt 49 Preferred stock 50 Common stock 51 Retained earnings 52 Total Liabilities + Shareholders' Equity 15,000.0 14,000.0 19,000.0 17,000.0 19,000.0 check for imbalance 2016 2017 NOTES revenue - increase in receivables Strawman Corporation Statement of Cash Flows For year ended 12/31/... ALL FIGURES IN $000s 59 Cash flows from operations (DIRECT) 60 Cash collections from customers 61 LESS: 62 Cash paid for merchandise 63 Cash paid for SG&A 64 Cash paid for interest 65 Cash paid for income taxes 66 Net cash provided (used) by operating activities COGS + increase in inventory - increase in payables SG&A - depreciation - increase in accruals starting line 68 Cash flows from operations (INDIRECT) 69 Net income 70 Adjustments to reconcile net income to net cash provided by operating activities 71 Depreciation 72 Gain on sale of investments 73 Change in inventory 74 Change in receivables 75 Change in accounts payable 76 Change in accrued liabilities 77 Net cash provided (used) by operating activities non-cash, add back non-operating, subtract if gain decrease = source increase = use increase = source decrease = use 79 80 Cash flows from investing activities 81 Sale of held-to-maturity investments sale = source 80 Cash flows from investing activities 81 Sale of held-to-maturity investments 82 Purchase of plant assets 83 Net cash provided (used) by investing activities sale = source purchase = use 86 Cash flows from financing activities 87 Issuance of capital stock 88 Proceeds from (repayment of) long-term debt 89 Proceeds from (repayment of) short-term debt 90 Payment of cash dividends to preferred stock 91 Payment of cash dividends to common stock 92 Net cash provided (used) by financing activities issuance = source repayment = use proceeds = source (2,600.0) use 94 Net increase in cash 95 Cash, beginning of year 96 Cash, end of year feeds the balance sheet cash figure 97 98 Noncash investing and financing activities 99 Issuance of common stock for PP&E $ 700.0