Fill out the chart for each year
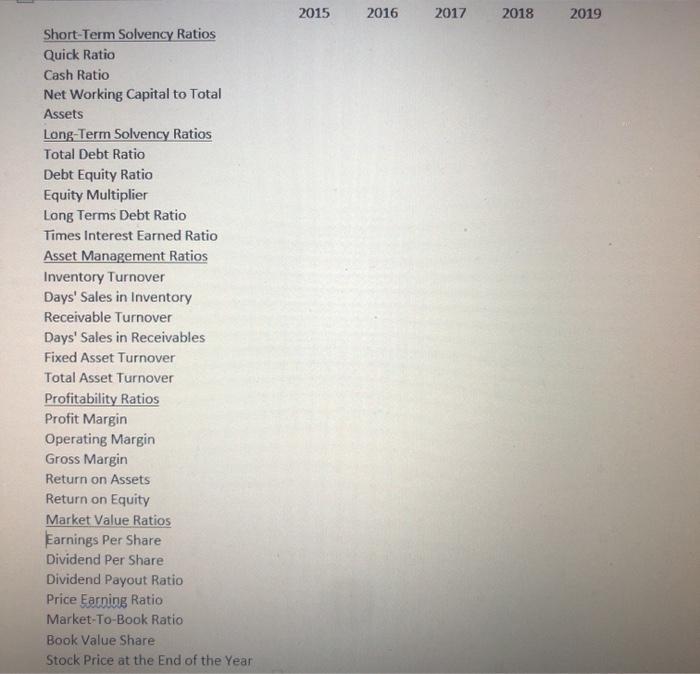
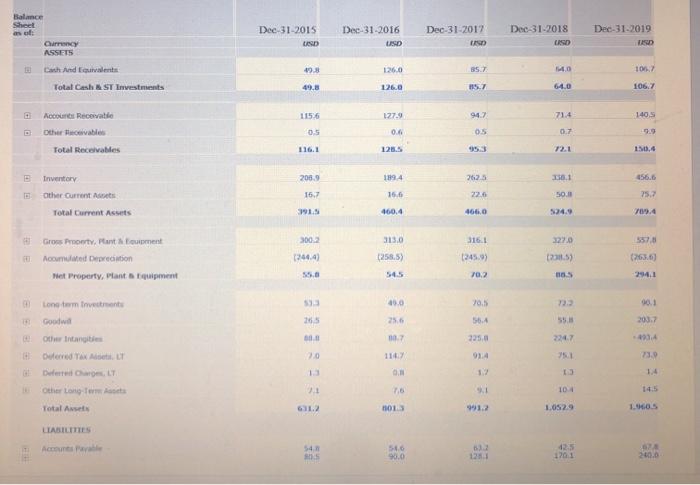
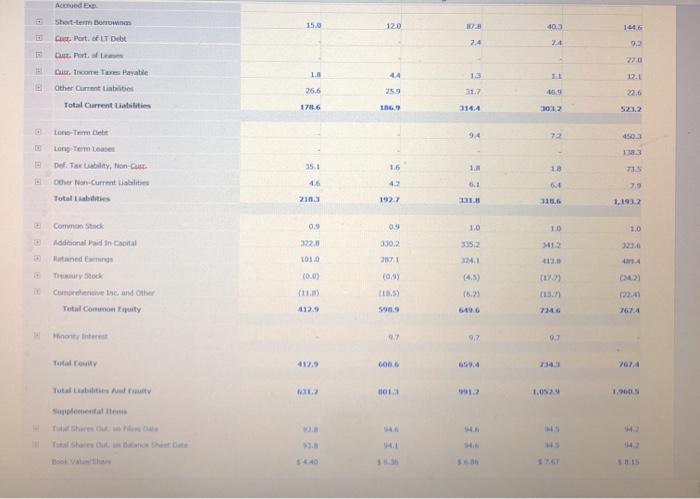
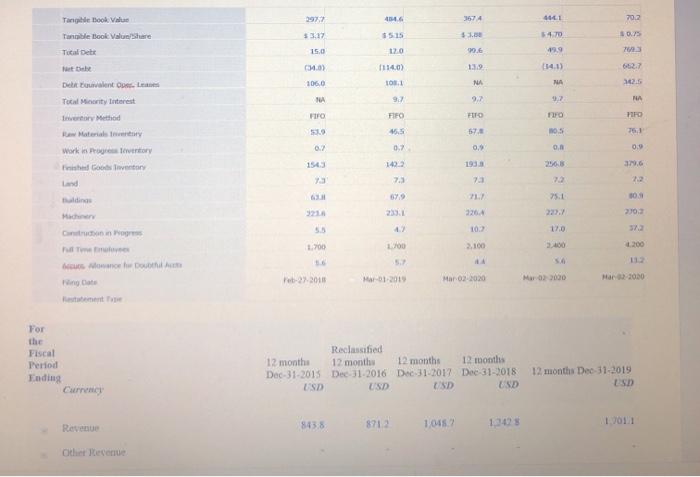
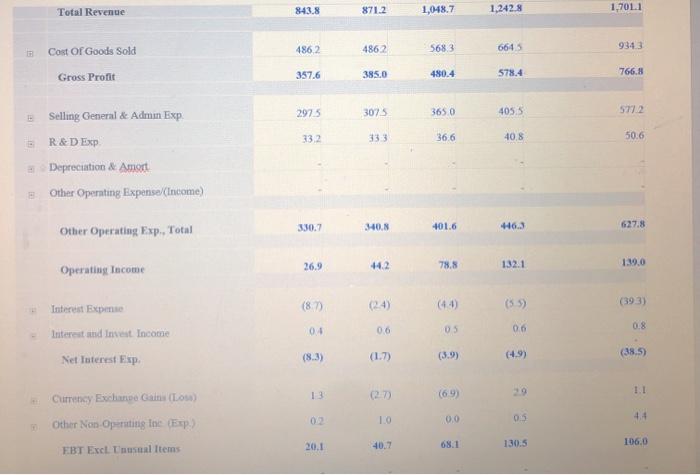
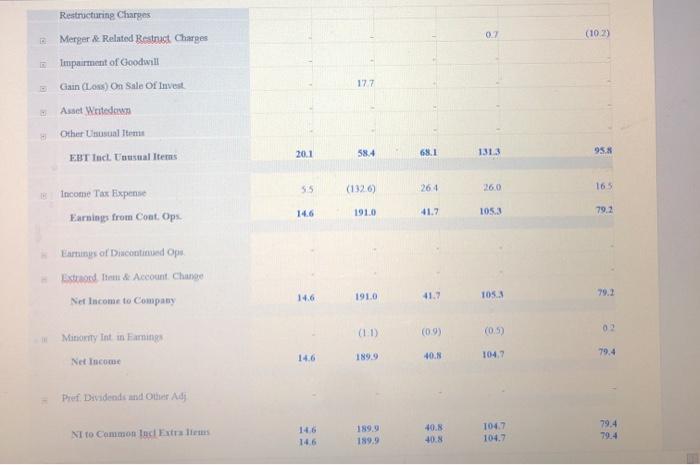
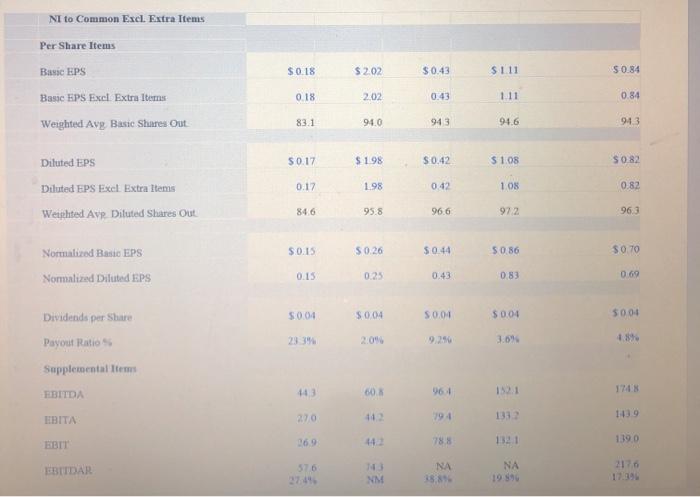
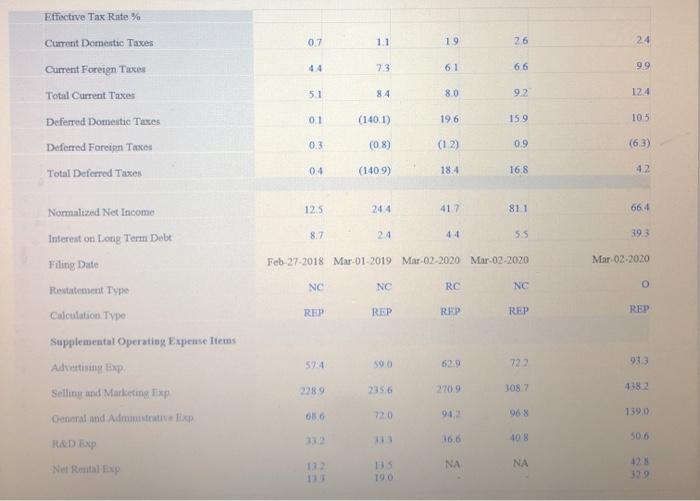
2015 2016 2017 2018 2019 Short-Term Solvency Ratios Quick Ratio Cash Ratio Net Working Capital to Total Assets Long-Term Solvency Ratios Total Debt Ratio Debt Equity Ratio Equity Multiplier Long Terms Debt Ratio Times Interest Earned Ratio Asset Management Ratios Inventory Turnover Days' Sales in Inventory Receivable Turnover Days' Sales in Receivables Fixed Asset Turnover Total Asset Turnover Profitability Ratios Profit Margin Operating Margin Gross Margin Return on Assets Return on Equity Market Value Ratios Earnings Per Share Dividend Per Share Dividend Payout Ratio Price Earning Ratio Market-To-Book Ratio Book Value Share Stock Price at the End of the Year Balance Sheet Dee-31-2015 Dec-31-2018 Dec-31-2016 USD Dec-31-2017 USD Dec-31-2019 LAS RSD Currency ASSETS 493 126.0 857 106.7 Cash And Events Total Cash A ST Investments 49.8 126.0 5 640 106.7 1156 127.9 942 71.4 140.5 Room Rent Other cables Total Receivables 05 0.6 015 0.7 5.9 116.1 1285 12.1 10.4 206.9 2625 150.1 Inventory Other Current Total Current Assets 15,7 226 50.0 75.7 3915 460.4 4600 134.0 3002 313.0 27.0 5575 Gross Pronty. Pantoment Accumulated Depreciation Net Property, Plant quipment (2464) (258,5) (245.93 2015) (263.69 70.2 10.5 2941 0.5 Long term Investments Goodwie 25 56.4 203. 225, 2247 34 Other Intangiti Ofered Tax Act, Der LT 20 114 914 12 13 1.4 7,6 104 Total As 611 2015 91.2 1.0529 LIABILITIES Aces 425 90.0 1211 2.0 Acord Short-term Bonomics 150 120 4023 16, 2.4 92 Que Port of Debt Part of 1 44 12. Cur. Income Taxes Payable Gither Current Liabilities Total Current Liabilities 26.5 11.7 1711.6 1 3164 9.4 72 4503 tone Termine Long Term Le Defteribility, Non- Over on-Current Libilities Totalttes 35.1 1.6 10 46 4 2103 118 315.6 1,191.2 Comment 09 09 1.0 TO 1.0 Addisional din Caortal 322 3302 3352 und Ewing 1010 2171 41 (0:0) (09) 4.5) The Stock Comments and other Total Contity 03-02) 122.40 (11. 1.5) 16.23 son 7246 Hinonty interest 9.7 3.7 TV 412.5 con . 101 12 1.05 1.90 ILI 2927 40 3674 ALL 702 Tangok Value Tangible Book Valu/Share Total Det 53.17 5515 4.70 0.75 15.0 20 99.6 429 26 (14) 1:39 662.7 11140) 10.1 106,0 NA NA 05 NA Debitovalent Co. Le Total Monty terest wory Method 9. 9.7 92 NA FIFO FIFO TO FIFO SO 45.5 57. OS 0.7 0, 08 0. Work in Progresory Finished Goosen 1545 39.6 7.3 72 22 71 . tudine Machine 2264 2102 5.5 10. 52 Construction in progress 1.700 2.100 14 11 Douth Feb-2011 Mar 02-2020 Mar2000 For the Fiscal Period Ending Currency Reclassified 12 months 12 months 12 months 12 months Dec-31-2015 Dec 31 2016 Dec 31-2017 Dec 31-2018 USD USD UND 12 months Dec 31-2019 USD Revenue 8458 8912 1.0457 Other Recente 843.8 Total Revenue 871.2 1,048.7 1,242.8 1,7011 4862 4862 5683 66415 9343 Cost or Goods Sold Gross Profit 357,6 385.0 480.4 578.4 766.8 2975 3025 365 0 4055 577.2 332 36.6 40,8 50.6 Selling General & Admin Exp R&D Exp Depreciation & Amort Other Operating Expense (Income) 330.7 30N 401.6 46.3 627.8 Other Operating Exp., Total 26.9 442 78.8 132.1 Operating Income 139,0 (393) (8) 04 0.8 06 03 0.0 Interest Expm Interest and Invest Income Net Interest Exp (17) (4.9) (38.5) 13 (69) 1.1 Currency Exchange Gains (Low) Other Non Operating Inc Exp.) 1.0 0.0 09 20.1 40.7 68.1 130.5 106.0 EBT Excl Unusual Items Restructuring Charges 0 (102) Merger & Related Restrict Charges 17.7 Impairment of Goodwill Gain (Loss) On Sale Of Invest Asset Writeden Other Unusual Items EBT Inc. Usual Items 201 58.4 68.1 1313 95.8 515 (1326) 26 260 165 Income Tax Expense 146 1910 41.7 79,2 1053 Earnings from Cont. Ops. Eartungs of Discontinued Opu Extraord & Account Chance 14.6 1910 41.7 1053 79.2 Net Income to Company 02 (1:1) (0.9) (0.5 Minority Int in Farming 40. 79.4 104.7 189.9 Net Income 14,6 Pref. Dividends and Other Adj NI to Common Incl Extra 146 1:46 189.9 189.9 40.8 40.8 104.7 104.7 79.4 79.4 NI to Common Excl. Extra Items Per Share Items Base EPS $0.18 $ 202 $0.43 S111 S084 0.18 202 0.43 111 0.84 Basic EPS Excl. Extra Items Weighted Avg Basic Shares Out 83.1 940 943 946 943 Diluted EPS 50.17 $198 $0.42 $1.08 S0 82 Diluted EPS Excel Extra Items 0.17 198 0.42 1.08 0.82 84.6 Weighted Ave Diluted Shares Out 95.8 96.6 972 963 Normalized Bas EPS S015 50.26 50.44 50 86 S070 0.15 Normalized Diluted EPS 0.25 0.43 083 0.69 Dividends per Share S004 $ 0.04 S004 $0.04 50.04 Payout Ratio 2834 2.09 9.29 4.89 3.6% Supplemental Items EBITDA 14 60.3 96 1321 1748 270 11 194 1332 1439 HBITA 4 EBIT 788 1321 139.0 EBIDAR 576 NA NA 3881 NM 0.7 11 19 26 24 73 6.1 66 9.9 Effective Tax Rate % Current Domestic Taxes Current Foreign Taxes Total Current Taxes Deferred Domestic Taxes Deferred Foreign Toxos Total Deferred Tones 51 84 80 92 124 01 (140.1) 196 159 105 0.3 (08) (12) 0.9 (63) 04 (1409) 18.4 16.8 42 125 24.4 417 811 Normalized Net Income 664 8.7 24 44 55 393 Interest on Long Term Debt Filing Date Feb 27 2018 Mar-01-2019 Mar 02-2020 Mar-02-2020 Mar 02-2020 NC Restatement Type NC RC NC O Calculation Type REP REP REP REP REP 57:4 59.0 620 722 933 Supplemental Operating Expense Items Advertising Exp Selling and Marketing Exp Central and Administrative xp 2389 2356 2709 3087 4382 72.0 942 139,0 16.6 108 LED EXP 13 NA NA Nel Rental Exp 190 339 2015 2016 2017 2018 2019 Short-Term Solvency Ratios Quick Ratio Cash Ratio Net Working Capital to Total Assets Long-Term Solvency Ratios Total Debt Ratio Debt Equity Ratio Equity Multiplier Long Terms Debt Ratio Times Interest Earned Ratio Asset Management Ratios Inventory Turnover Days' Sales in Inventory Receivable Turnover Days' Sales in Receivables Fixed Asset Turnover Total Asset Turnover Profitability Ratios Profit Margin Operating Margin Gross Margin Return on Assets Return on Equity Market Value Ratios Earnings Per Share Dividend Per Share Dividend Payout Ratio Price Earning Ratio Market-To-Book Ratio Book Value Share Stock Price at the End of the Year Balance Sheet Dee-31-2015 Dec-31-2018 Dec-31-2016 USD Dec-31-2017 USD Dec-31-2019 LAS RSD Currency ASSETS 493 126.0 857 106.7 Cash And Events Total Cash A ST Investments 49.8 126.0 5 640 106.7 1156 127.9 942 71.4 140.5 Room Rent Other cables Total Receivables 05 0.6 015 0.7 5.9 116.1 1285 12.1 10.4 206.9 2625 150.1 Inventory Other Current Total Current Assets 15,7 226 50.0 75.7 3915 460.4 4600 134.0 3002 313.0 27.0 5575 Gross Pronty. Pantoment Accumulated Depreciation Net Property, Plant quipment (2464) (258,5) (245.93 2015) (263.69 70.2 10.5 2941 0.5 Long term Investments Goodwie 25 56.4 203. 225, 2247 34 Other Intangiti Ofered Tax Act, Der LT 20 114 914 12 13 1.4 7,6 104 Total As 611 2015 91.2 1.0529 LIABILITIES Aces 425 90.0 1211 2.0 Acord Short-term Bonomics 150 120 4023 16, 2.4 92 Que Port of Debt Part of 1 44 12. Cur. Income Taxes Payable Gither Current Liabilities Total Current Liabilities 26.5 11.7 1711.6 1 3164 9.4 72 4503 tone Termine Long Term Le Defteribility, Non- Over on-Current Libilities Totalttes 35.1 1.6 10 46 4 2103 118 315.6 1,191.2 Comment 09 09 1.0 TO 1.0 Addisional din Caortal 322 3302 3352 und Ewing 1010 2171 41 (0:0) (09) 4.5) The Stock Comments and other Total Contity 03-02) 122.40 (11. 1.5) 16.23 son 7246 Hinonty interest 9.7 3.7 TV 412.5 con . 101 12 1.05 1.90 ILI 2927 40 3674 ALL 702 Tangok Value Tangible Book Valu/Share Total Det 53.17 5515 4.70 0.75 15.0 20 99.6 429 26 (14) 1:39 662.7 11140) 10.1 106,0 NA NA 05 NA Debitovalent Co. Le Total Monty terest wory Method 9. 9.7 92 NA FIFO FIFO TO FIFO SO 45.5 57. OS 0.7 0, 08 0. Work in Progresory Finished Goosen 1545 39.6 7.3 72 22 71 . tudine Machine 2264 2102 5.5 10. 52 Construction in progress 1.700 2.100 14 11 Douth Feb-2011 Mar 02-2020 Mar2000 For the Fiscal Period Ending Currency Reclassified 12 months 12 months 12 months 12 months Dec-31-2015 Dec 31 2016 Dec 31-2017 Dec 31-2018 USD USD UND 12 months Dec 31-2019 USD Revenue 8458 8912 1.0457 Other Recente 843.8 Total Revenue 871.2 1,048.7 1,242.8 1,7011 4862 4862 5683 66415 9343 Cost or Goods Sold Gross Profit 357,6 385.0 480.4 578.4 766.8 2975 3025 365 0 4055 577.2 332 36.6 40,8 50.6 Selling General & Admin Exp R&D Exp Depreciation & Amort Other Operating Expense (Income) 330.7 30N 401.6 46.3 627.8 Other Operating Exp., Total 26.9 442 78.8 132.1 Operating Income 139,0 (393) (8) 04 0.8 06 03 0.0 Interest Expm Interest and Invest Income Net Interest Exp (17) (4.9) (38.5) 13 (69) 1.1 Currency Exchange Gains (Low) Other Non Operating Inc Exp.) 1.0 0.0 09 20.1 40.7 68.1 130.5 106.0 EBT Excl Unusual Items Restructuring Charges 0 (102) Merger & Related Restrict Charges 17.7 Impairment of Goodwill Gain (Loss) On Sale Of Invest Asset Writeden Other Unusual Items EBT Inc. Usual Items 201 58.4 68.1 1313 95.8 515 (1326) 26 260 165 Income Tax Expense 146 1910 41.7 79,2 1053 Earnings from Cont. Ops. Eartungs of Discontinued Opu Extraord & Account Chance 14.6 1910 41.7 1053 79.2 Net Income to Company 02 (1:1) (0.9) (0.5 Minority Int in Farming 40. 79.4 104.7 189.9 Net Income 14,6 Pref. Dividends and Other Adj NI to Common Incl Extra 146 1:46 189.9 189.9 40.8 40.8 104.7 104.7 79.4 79.4 NI to Common Excl. Extra Items Per Share Items Base EPS $0.18 $ 202 $0.43 S111 S084 0.18 202 0.43 111 0.84 Basic EPS Excl. Extra Items Weighted Avg Basic Shares Out 83.1 940 943 946 943 Diluted EPS 50.17 $198 $0.42 $1.08 S0 82 Diluted EPS Excel Extra Items 0.17 198 0.42 1.08 0.82 84.6 Weighted Ave Diluted Shares Out 95.8 96.6 972 963 Normalized Bas EPS S015 50.26 50.44 50 86 S070 0.15 Normalized Diluted EPS 0.25 0.43 083 0.69 Dividends per Share S004 $ 0.04 S004 $0.04 50.04 Payout Ratio 2834 2.09 9.29 4.89 3.6% Supplemental Items EBITDA 14 60.3 96 1321 1748 270 11 194 1332 1439 HBITA 4 EBIT 788 1321 139.0 EBIDAR 576 NA NA 3881 NM 0.7 11 19 26 24 73 6.1 66 9.9 Effective Tax Rate % Current Domestic Taxes Current Foreign Taxes Total Current Taxes Deferred Domestic Taxes Deferred Foreign Toxos Total Deferred Tones 51 84 80 92 124 01 (140.1) 196 159 105 0.3 (08) (12) 0.9 (63) 04 (1409) 18.4 16.8 42 125 24.4 417 811 Normalized Net Income 664 8.7 24 44 55 393 Interest on Long Term Debt Filing Date Feb 27 2018 Mar-01-2019 Mar 02-2020 Mar-02-2020 Mar 02-2020 NC Restatement Type NC RC NC O Calculation Type REP REP REP REP REP 57:4 59.0 620 722 933 Supplemental Operating Expense Items Advertising Exp Selling and Marketing Exp Central and Administrative xp 2389 2356 2709 3087 4382 72.0 942 139,0 16.6 108 LED EXP 13 NA NA Nel Rental Exp 190 339