

Answered step by step
Verified Expert Solution
Question
1 Approved Answer
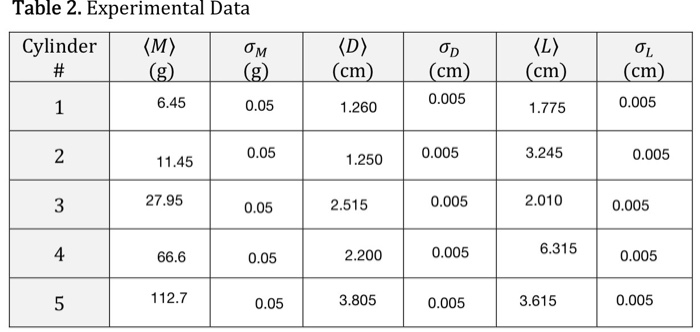
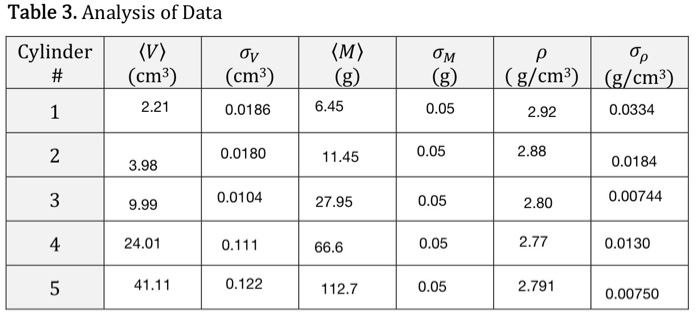
fill out the Table 4. Results pls Table 2. Experimental Data Cylinder (M) OM # (D) OL (cm) OD (cm) 0.005 (L) (cm) (cm) 1

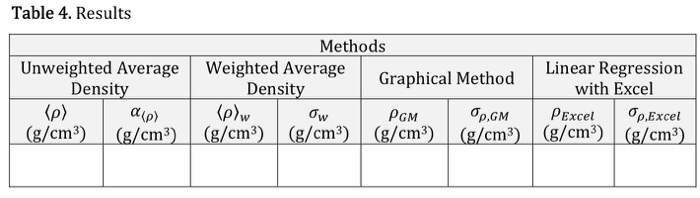
fill out the Table 4. Results pls
Table 2. Experimental Data Cylinder (M) OM # (D) OL (cm) OD (cm) 0.005 (L) (cm) (cm) 1 1 6.45 0.05 1.260 1.775 0.005 2 0.05 0.005 11.45 1.250 3.245 0.005 3 27.95 0.05 2.515 0.005 2.010 0.005 4 66.6 0.05 2.200 6.315 0.005 0.005 5 112.7 0.05 3.805 0.005 3.615 0.005 Table 2. Experimental Data Cylinder (M) OM # (D) OL (cm) OD (cm) 0.005 (L) (cm) (cm) 1 1 6.45 0.05 1.260 1.775 0.005 2 0.05 0.005 11.45 1.250 3.245 0.005 3 27.95 0.05 2.515 0.005 2.010 0.005 4 66.6 0.05 2.200 6.315 0.005 0.005 5 112.7 0.05 3.805 0.005 3.615 0.005 Table 3. Analysis of Data Cylinder (v) # (cm3) (cm3) (M) OM (g/cm3) (g/cm3) 1 2.21 0.0186 6.45 0.05 2.92 0.0334 2 0.0180 11.45 0.05 2.88 3.98 0.0184 3 9.99 0.0104 27.95 0.05 2.80 0.00744 4 24.01 0.111 66.6 0.05 2.77 0.0130 5 41.11 0.122 112.7 0.05 2.791 0.00750 Table 4. Results Unweighted Average Density (p) (g/cm3) (g/cm3) Methods Weighted Average Linear Regression Graphical Method Density with Excel (p) Ow PGM ,GM PExcel Op.Excel (g/cm3) (g/cm3) (g/cm3) (g/cm3) (g/cm3) (g/cm3) alp) Table 2. Experimental Data Cylinder (M) OM # (D) OL (cm) OD (cm) 0.005 (L) (cm) (cm) 1 1 6.45 0.05 1.260 1.775 0.005 2 0.05 0.005 11.45 1.250 3.245 0.005 3 27.95 0.05 2.515 0.005 2.010 0.005 4 66.6 0.05 2.200 6.315 0.005 0.005 5 112.7 0.05 3.805 0.005 3.615 0.005 Table 2. Experimental Data Cylinder (M) OM # (D) OL (cm) OD (cm) 0.005 (L) (cm) (cm) 1 1 6.45 0.05 1.260 1.775 0.005 2 0.05 0.005 11.45 1.250 3.245 0.005 3 27.95 0.05 2.515 0.005 2.010 0.005 4 66.6 0.05 2.200 6.315 0.005 0.005 5 112.7 0.05 3.805 0.005 3.615 0.005 Table 3. Analysis of Data Cylinder (v) # (cm3) (cm3) (M) OM (g/cm3) (g/cm3) 1 2.21 0.0186 6.45 0.05 2.92 0.0334 2 0.0180 11.45 0.05 2.88 3.98 0.0184 3 9.99 0.0104 27.95 0.05 2.80 0.00744 4 24.01 0.111 66.6 0.05 2.77 0.0130 5 41.11 0.122 112.7 0.05 2.791 0.00750 Table 4. Results Unweighted Average Density (p) (g/cm3) (g/cm3) Methods Weighted Average Linear Regression Graphical Method Density with Excel (p) Ow PGM ,GM PExcel Op.Excel (g/cm3) (g/cm3) (g/cm3) (g/cm3) (g/cm3) (g/cm3) alp) Step by Step Solution
There are 3 Steps involved in it
Step: 1

Get Instant Access to Expert-Tailored Solutions
See step-by-step solutions with expert insights and AI powered tools for academic success
Step: 2

Step: 3
Ace Your Homework with AI
Get the answers you need in no time with our AI-driven, step-by-step assistance
Get Started
Social Media Audit And Stats Audit And Statistics For Social Media Platforms
Authors: Virtual Desk Tools
1st Edition
B09JDX8Z9M, 979-8492994938