

Question
FIN 301: Penn State World Campus Final Excel project Scenario: Tom Jones, the CFO for the firm PSUWC Energy, LLC, woke up with a start
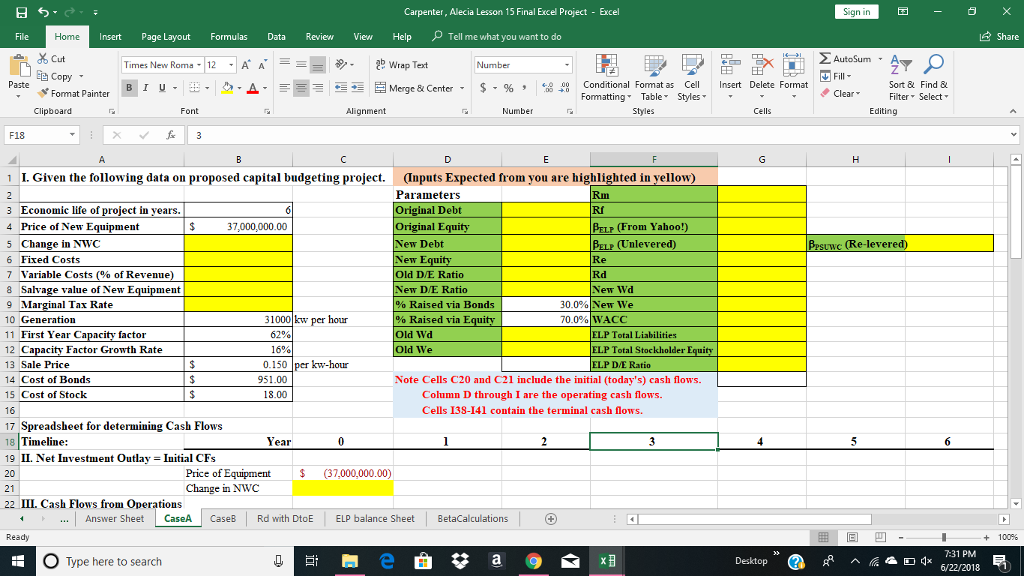
| FIN 301: Penn State World Campus Final Excel project Scenario: Tom Jones, the CFO for the firm PSUWC Energy, LLC, woke up with a start at 4:00 am on 6/19/2018, due to his phone ringing. It was his senior financial analyst, vacationing in Europe, calling with bad news. Tom was supposed to present his project evaluation, at the end of the week, for the Board's proposal that they invest in new equipment that generates electricity, using a new nuclear technology. His staff of financial analysts had been working hard over the last few weeks collecting data and had prepared a model creating a financial forecast about the proposed project's viability. Disaster had struck on the night of 6/18/2018 wherein malware all but wiped out the work of the analysts. Tom needed to prepare a financial analysis of the project to present the Board with his recommendations. All the staff had already left for their annual vacation and Tom was on his own. Tom quickly reached his office and managed to salvage what was left of the excel spreadsheet prepared for the presentation. What follows is some basic information that Tom knew and was able to retrieve about the project. |
| PSUWC's existing plant has excess capacity, in a fully depreciated building, to install and run the new equipment. Due to relatively rapid advances in the technology, the project was expected to be discontinued in six years. The proposed project was capable of providing 31000 kW [1] per hour power. Typically, PSUWC ran its plants 24 hours a day, 7 days a week at an average of 62 % Capacity factor [2] , which is what the project would start with. However, his engineers had assured him that the implementation of the new technology would enable them to increase their capacity factor by 16 % a year till they reached a 100% capacity factor. (This meant that the capacity factor for year 2, CF2, would be = CF1*(1+growth_rate), till 100% was reached and then would stay at 100%). A total investment of $ 37,000,000.00 USD for new equipment was required. The equipment had fixed maintenance contracts of $ 3,500,000.00 per year with a salvage value of $ 8,000,000.00 and variable costs were 54 % of revenues. |
| The new equipment would be depreciated to zero using straight line depreciation. The new project required an increase in working capital of $ 6,000,000.00 and $ 1,400,000.00 of this increase would be offset with accounts payable. PSUWC would be able to sell all the electricity it generated at the rate of $ 0.150 per kilo-watt hour in the market they served. |
| The corporate tax rate was 38 % and PSUWC currently has 1,000,000 shares of stock outstanding at a current price of $ 18.00. The company also has 30,000 bonds outstanding, with a current price of $ 951.00. The bonds pay interest semi-annually at a coupon rate of 5.20 %. The bonds have a par value of $1,000 and will mature in 18 years. |
| Even though the company has stock outstanding it is not publicly traded. Therefore, there is no publicly available financial information. However, management believes that given the industry they are in the most reasonable comparable publicly traded company is Companhia Paranaense de Energia - COPEL (NYSE Ticker Symbol ELP) [3] . In addition, management believes the S&P 500 is a reasonable proxy for the market portfolio. Therefore, the cost of equity is calculated using the beta from ELP and the market risk premium based on the S&P 500 annual expected rate of return [4]. Tom knew that because of the size of the proposed project, he had to take into account the change in capital structure the new project would cause his firm. To this end, he had a choice between raising the new capital needed either using 30 % /70 % split between issuing bonds/equity or a 70 % /30 % split between issuing bonds/equity . The bonds would have to be retired at the end of the project's life [6]. Tom knew that the cost of debt would depend on the new D/E ratio that the firm would have based on his decision to raise capital. Tom looked at the worksheet titled Rd with DtoE, realizing that the cost of debt increased with an increasing D/E ratio [7] . Additionally, the state government had promised to raise the debt for PSUWC via the issuance of bonds, with the caveat that upon termination of the project PSUWC would have to pay a Nuclear Waste Disposal Fee, equivalent to the amount of money raised via the issuance of debt. |
| Tom needed to calculate the rate at which he would have to discount the project to calculate the Net present Value of the proposed project based on his decision of raising capital and the current capital market environment. This discount rate, the WACC, would obviously influence the NPV and could affect the decision of whether or not to accept the project. Thankfully, he had all the information needed to calculate this and hence the NPV. Tom needed to clearly show all his calculations and sources for all parameter estimates used in the calculation of the WACC. Gathering all the available information, Tom got a large cup of extra strong coffee and sat down to work on the development of his Capital Budgeting project model. His correct recommendation to the board was critical to the future growth of the firm! |
| Minimum requirements for the Project. 1. Calculate the WACC for the company. 2. Create a partial income statement incremental cash flows from this project in the Blank Template worksheet. 3. Enter formulas to calculate the NPV by finding the PV of the cash flows over the next six years. (You can either use the EXCEL formula PV() or use mathematical formula for PV of a lump sum.) 4. Set up the EXCEL worksheet so that you are able to change the parameters in B4-B12, E3-E8,& G11-G12. These are highlighted in Yellow on the Blank template. The other cells which need input from you are highlighted in Light Blue on both worksheets. Run the two cases: CaseA and CaseB. The D/E split for raising new capital are already filled in in the worksheets. The numbers in the worksheet CaseB, which are identical to the numbers in worksheet CaseA will populate automatically when you fill in information in the worksheet CaseA - These are highlighted in Orange. The numbers in CaseB which DO NOT populate need to be calculated. Note that it is important to use the VLOOKUP function for calculating the cost of debt for automatic updating of the excel sheet. 5. Cells B54:64 List the Debt Fraction for New Capital varying from 0% to 100%. Using the Data Table Concept, calculate the WACC and NPV for each value. 6. Using the data generated using Data Tables, plot the NPV & WACC as a function of Debt Fraction. Make sure to plot the NPV on the primary Y-axis and the WACC on the secondary Y-axis. The Debt Fraction should be on the X-axis. Alternately, you can also plot NPV & Debt Fraction as a function of WACC. If you do so, ensure that you plot the NPV on the primary Y-axis and the Debt Fraction on the secondary Y-axis. The WACC should be on the X-axis in this case. |
| Comment on any peculiarities you may notice in this plot and discuss the possible reasons for these (whether this plot looks different from the NPV Profiles you have studied before, where the NPV is plotted as a function of the discount rate etc). Be specific as to why there may be differences. For your reference, a typical NPV profile is plotted below cells A69-G78 using some random cash flows. Cells A69-G78 contains the data and calculations used to generate the plot shown. NOTE: There is a plethora of information available on the Internet regarding creating plots in excel (Google - how to plot a graph in excel) and creating plots with secondary axis (Google - how to plot a graph in excel with two y axis). 7. Make a clear recommendation whether the company should accept or reject the project for each case scenario. 8. If you have any discussion/explanation for any assumptions you have made or need to provide more discussion, you may do so on the worksheet titled Answer Sheet 9. Turn in your project in the drop box. |
| [1] kW stands for kilo-watt or 1000 watts. A watt is a measure of power. Electricity is priced in kWh (kilo-watt hours). 1 kilo-watt hour represents 1000 Watts of power expended for one hour (1 h) of time. The average price people in the U.S. pay for electricity is about 12 cents per kilowatt-hour. (Context: A typical U.S. household uses about 908 kWh a month of electricity.) [2] The net capacity factor of a power plant is the ratio of its actual output over a period of time, to its potential output if it were possible for it to operate at full nameplate capacity continuously over the same period of time. To calculate the capacity factor, take the total amount of energy the plant produced during a period of time and divide by the amount of energy the plant would have produced at full capacity. Capacity factors vary greatly depending on the type of fuel that is used and the design of the plant. [3] Companhia Paranaense de Energia - COPEL engages in the generation, transmission, distribution, and sale of electricity to industrial, residential, commercial, rural, and other customers primarily in the State of Paran, Brazil. As of December 31, 2015, the company operated 18 hydroelectric plants, 12 wind plants, and 1 thermoelectric plant with a total installed capacity of 5,032.2 megawatts; and owned and operated 2,344 kilometers of transmission lines and 193,527.1 kilometers of distribution lines. It holds concessions to distribute electricity in 394 municipalities in the State of Paran and in the municipality of Porto Unio in the State of Santa Catarina. The company also provides telecommunication services to 4,964 corporate clients, including supermarkets, universities, banks, Internet service providers, and television networks, as well as to 43,023 retail clients; and broadband Internet access to public elementary and middle schools. In addition, it supplies piped gas to 31,790 customers, including thermoelectric plants, cogeneration plants, gas stations, other businesses, and residences through a gas distribution network covering 780 kilometers in the State of Paran. Companhia Paranaense de Energia - COPEL was founded in 1954 and is headquartered in Curitiba, Brazil. Source: http://finance.yahoo.com/q/pr?s=ELP+Profile |
| [4] Tom would calculate the Expected Return on the Market using 5 years of past monthly data. Therefore, he would collect 61 months of price data for the S&P and calculate the returns for the past 60 months. He would then multiply this by 12 to estimate the annual expected rate. Tom, remembered that if the expected rate of return for the market was too low, too high, or negative, he would have to use a forward looking rate of an historical average of about 9.5%, as the calculated value for the current 5-year period may not be a representation of the future. Tom would consider a E(Rm) between 8-12% acceptable. [5] This meant that, for example, if he needed to raise $34,000,000 & if he used a 75/25% split between issuing bonds/equity, he would raise 75% of the needed capital of $34,000,000 by issuing bonds and the rest through issuing equity. Costs of issuing new bonds and equity are ignored for the purposes of this project. [6] This meant that the capital raised via issuing debt would have to be returned to the investors at the end of the projects life. [7] For example, a D/E ratio between 1.0 to 1.5 meant that the cost of debt would be 5.3% in the current climate. [8] Tom remembered that when he considered the Risk-free rate (Rf) in his calculations, he should consider the risk-free rate with a maturity similar to that of his project. He decided to use the 5-year rate available from the Treasury website for his calculations. |
|
|
Step by Step Solution
There are 3 Steps involved in it
Step: 1

Get Instant Access to Expert-Tailored Solutions
See step-by-step solutions with expert insights and AI powered tools for academic success
Step: 2

Step: 3
Ace Your Homework with AI
Get the answers you need in no time with our AI-driven, step-by-step assistance
Get Started
Beat The Market Win With Proven Stock Selection And Market Timing Tools
Authors: Gerald Appel
1st Edition
0132359170,0137154526