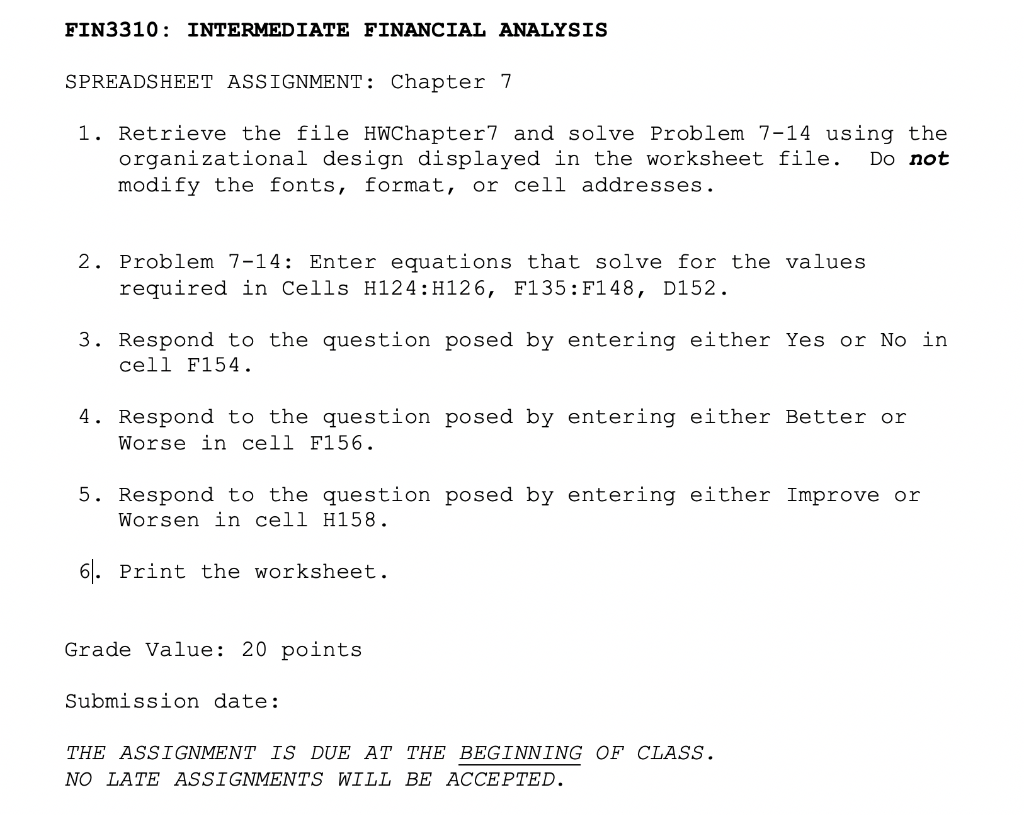
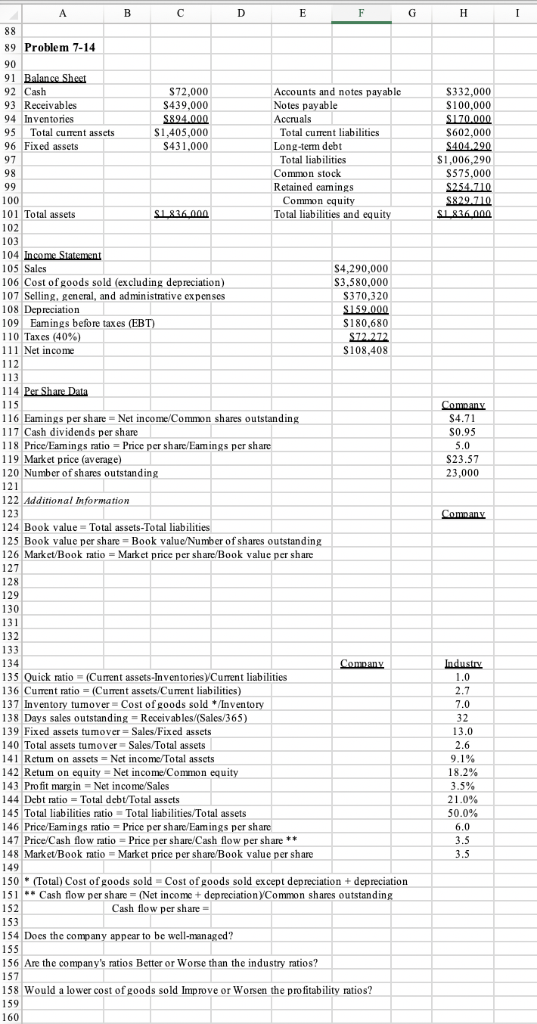
FIN3310: INTERMEDIATE FINANCIAL ANALYSIS SPREADSHEET ASSIGNMENT: Chapter 1. Retrieve the file HWChapter7 and solve Problem 7-14 using thee organizational design displayed in the worksheet file. Do not modify the fonts, format, or ce addresses 2. Problem 7-14: Enter equations that solve for the values required in Cells H124:H126, F135: F148, D152. 3. Respond to the question posed by entering either Yes or No in cell F154. 4. Respond to the question posed by entering either Better or worse in ce F1 56. 5. Respond to the question posed by entering either Improve or Worsen in cell H158 6. Print the worksheet. Grade Value: 20 points Submission date: THE ASSIGNMENT IS DUE AT THE BEGINNING OF CLASS. NO LATE ASSIGNMENTS WILL BE ACCEPTED. 89 Problem 7-14 90 91 Balance Sheet 92 Cash 93 Receivables 94 Inventories 95 Total curent assets 96 Fixed assets $72,000 S439,000 Accounts and notes payable Notes payable Accruals S332,000 S100,000 S602,000 $1,006,290 S1,405,000 S431,000 Total current liabilitics Long-term debt Total liabilitics Common stock Retained eamings $575,000 100 101 Total assets 102 103 104 105 Sales 106 Cost ofgoods sold (excluding depreciation) 07 Selling, general, and administrative expenses 108 Depreciation 09 Eamings before taxes (EBT 110 Taxes (40%) 111 Net income Common equity Total liabilities and equity S4,290,000 S3,580,000 S370,320 S180,680 108,408 113 114 Per Share Data 115 116 Eamings per share Net income Common shares outstanding 117 Cash dividends per share 118 Pricc/Eamings ratio Price per share/Eamings per share 119 Market price (average 20 Number of shares outstandin $4.71 S0.95 $23.57 23,000 122 Additional information 123 124 Book value- Total assets-Total liabilities 125 Book value per share Book valueNumber of shares outstanding 26 Market/Book ratio Market price per share Book value per share 127 128 129 130 132 133 134 135 Quick ratio (Current assets-Inventories Current liabilities 36 Current ratio-(Current assets/Current liabilities) 137 Inventory tumover Cost of goods sold Inventory 138 Days sales outstanding Receivables(Sales/365) 139 Fixed assets tumover Sales/Fixed assets 140 Total assets tumover Sales/Total assets 141 Retum on asscts Nct incomc/Total assets 142 Retum on equity Net income Common equit 43 Profit marg in Net income Sales 144 Debt ratio Total dcbt Total assets 145 Total liabilities ratio Total liabilities/Total assets 146 Price/Eamings ratio Price per sharc/Eamings per sharc 147 Price/Cash flow ratio Price per share/Cash flow per share 148 MarketBook ratio Market price per share/Book value per share 13.0 9.1% 18.2% 3.5% 2 1.0% 50.0% 150(Total) Cost ofgoods sold - Cost of goods sold except depreciation+ depreciation 151 Cash flow per share (Net income+ depreciationCommon shares outstanding 152 153 154 Does the company appear to be well-managed? 155 156 Are the company's ratios Better or Worse than the industry ratios? 157 158 Would a lower cost of goods sold Improve or Worsen the profitability ratios? 159 160 Cash flow per share FIN3310: INTERMEDIATE FINANCIAL ANALYSIS SPREADSHEET ASSIGNMENT: Chapter 1. Retrieve the file HWChapter7 and solve Problem 7-14 using thee organizational design displayed in the worksheet file. Do not modify the fonts, format, or ce addresses 2. Problem 7-14: Enter equations that solve for the values required in Cells H124:H126, F135: F148, D152. 3. Respond to the question posed by entering either Yes or No in cell F154. 4. Respond to the question posed by entering either Better or worse in ce F1 56. 5. Respond to the question posed by entering either Improve or Worsen in cell H158 6. Print the worksheet. Grade Value: 20 points Submission date: THE ASSIGNMENT IS DUE AT THE BEGINNING OF CLASS. NO LATE ASSIGNMENTS WILL BE ACCEPTED. 89 Problem 7-14 90 91 Balance Sheet 92 Cash 93 Receivables 94 Inventories 95 Total curent assets 96 Fixed assets $72,000 S439,000 Accounts and notes payable Notes payable Accruals S332,000 S100,000 S602,000 $1,006,290 S1,405,000 S431,000 Total current liabilitics Long-term debt Total liabilitics Common stock Retained eamings $575,000 100 101 Total assets 102 103 104 105 Sales 106 Cost ofgoods sold (excluding depreciation) 07 Selling, general, and administrative expenses 108 Depreciation 09 Eamings before taxes (EBT 110 Taxes (40%) 111 Net income Common equity Total liabilities and equity S4,290,000 S3,580,000 S370,320 S180,680 108,408 113 114 Per Share Data 115 116 Eamings per share Net income Common shares outstanding 117 Cash dividends per share 118 Pricc/Eamings ratio Price per share/Eamings per share 119 Market price (average 20 Number of shares outstandin $4.71 S0.95 $23.57 23,000 122 Additional information 123 124 Book value- Total assets-Total liabilities 125 Book value per share Book valueNumber of shares outstanding 26 Market/Book ratio Market price per share Book value per share 127 128 129 130 132 133 134 135 Quick ratio (Current assets-Inventories Current liabilities 36 Current ratio-(Current assets/Current liabilities) 137 Inventory tumover Cost of goods sold Inventory 138 Days sales outstanding Receivables(Sales/365) 139 Fixed assets tumover Sales/Fixed assets 140 Total assets tumover Sales/Total assets 141 Retum on asscts Nct incomc/Total assets 142 Retum on equity Net income Common equit 43 Profit marg in Net income Sales 144 Debt ratio Total dcbt Total assets 145 Total liabilities ratio Total liabilities/Total assets 146 Price/Eamings ratio Price per sharc/Eamings per sharc 147 Price/Cash flow ratio Price per share/Cash flow per share 148 MarketBook ratio Market price per share/Book value per share 13.0 9.1% 18.2% 3.5% 2 1.0% 50.0% 150(Total) Cost ofgoods sold - Cost of goods sold except depreciation+ depreciation 151 Cash flow per share (Net income+ depreciationCommon shares outstanding 152 153 154 Does the company appear to be well-managed? 155 156 Are the company's ratios Better or Worse than the industry ratios? 157 158 Would a lower cost of goods sold Improve or Worsen the profitability ratios? 159 160 Cash flow per share