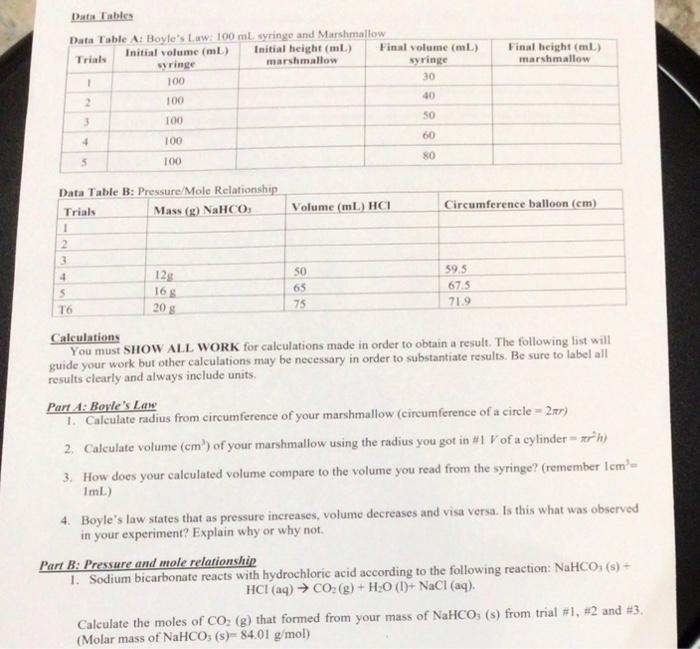
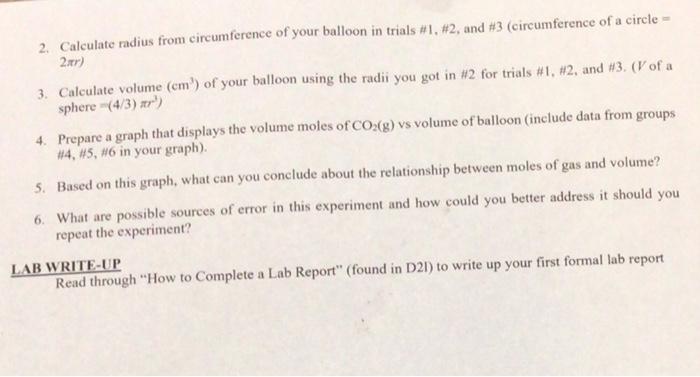
Final height (ml) marshmallow Data Tables Data Table A: Boyle's Law: 100 mL syringe and Marshmallow Initial volume (ml) Initial height (mL) Trials Final volume (mL) syringe marshmallow syringe 1 100 30 100 40 3 100 50 60 4 100 80 5 100 Volume (mL) HCI Circumference balloon (cm) Data Table B: Pressure/Mole Relationship Trials Mass (g) NaHCO 1 2 3 4 128 5 T6 50 65 75 59.5 67.5 71.9 165 20$ Calculations You must SHOW ALL WORK for calculations made in order to obtain a result. The following list will guide your work but other calculations may be necessary in order to substantiate results. Be sure to label all results clearly and always include units. Part A: Boyle's Law 1. Calculate radius from circumference of your marshmallow (circumference of a circle=2) 2. Calculate volume (cm) of your marshmallow using the radius you got in #1 V of a cylinder - *h) 3. How does your calculated volume compare to the volume you read from the syringe? (remember Icm- ImL) 4. Boyle's law states that as pressure increases, volume decreases and visa versa. Is this what was observed in your experiment? Explain why or why not. Part B: Pressure and mole relationship 1. Sodium bicarbonate reacts with hydrochloric acid according to the following reaction: NaHCO: (s) + HCI (aq) + CO2(g) + H2O (1)+ NaCl (aq). Calculate the moles of CO: (g) that formed from your mass of NaHCO, (s) from trial #1, #2 and #3. (Molar mass of NaHCO3(s)- 84.01 g/mol) 2. Calculate radius from circumference of your balloon in trials #1, #2, and #3 (circumference of a circle - 2x) 3. Calculate volume (cm') of your balloon using the radii you got in #2 for trials #1, #2, and #3. (V of a sphere (4/3) #r) 4. Prepare a graph that displays the volume moles of CO2(g) vs volume of balloon (include data from groups #4, 45, #6 in your graph). 5. Based on this graph, what can you conclude about the relationship between moles of gas and volume? 6. What are possible sources of error in this experiment and how could you better address it should you repeat the experiment? LAB WRITE-UP Read through "How to Complete a Lab Report" (found in D2I) to write up your first formal lab report Final height (ml) marshmallow Data Tables Data Table A: Boyle's Law: 100 mL syringe and Marshmallow Initial volume (ml) Initial height (mL) Trials Final volume (mL) syringe marshmallow syringe 1 100 30 100 40 3 100 50 60 4 100 80 5 100 Volume (mL) HCI Circumference balloon (cm) Data Table B: Pressure/Mole Relationship Trials Mass (g) NaHCO 1 2 3 4 128 5 T6 50 65 75 59.5 67.5 71.9 165 20$ Calculations You must SHOW ALL WORK for calculations made in order to obtain a result. The following list will guide your work but other calculations may be necessary in order to substantiate results. Be sure to label all results clearly and always include units. Part A: Boyle's Law 1. Calculate radius from circumference of your marshmallow (circumference of a circle=2) 2. Calculate volume (cm) of your marshmallow using the radius you got in #1 V of a cylinder - *h) 3. How does your calculated volume compare to the volume you read from the syringe? (remember Icm- ImL) 4. Boyle's law states that as pressure increases, volume decreases and visa versa. Is this what was observed in your experiment? Explain why or why not. Part B: Pressure and mole relationship 1. Sodium bicarbonate reacts with hydrochloric acid according to the following reaction: NaHCO: (s) + HCI (aq) + CO2(g) + H2O (1)+ NaCl (aq). Calculate the moles of CO: (g) that formed from your mass of NaHCO, (s) from trial #1, #2 and #3. (Molar mass of NaHCO3(s)- 84.01 g/mol) 2. Calculate radius from circumference of your balloon in trials #1, #2, and #3 (circumference of a circle - 2x) 3. Calculate volume (cm') of your balloon using the radii you got in #2 for trials #1, #2, and #3. (V of a sphere (4/3) #r) 4. Prepare a graph that displays the volume moles of CO2(g) vs volume of balloon (include data from groups #4, 45, #6 in your graph). 5. Based on this graph, what can you conclude about the relationship between moles of gas and volume? 6. What are possible sources of error in this experiment and how could you better address it should you repeat the experiment? LAB WRITE-UP Read through "How to Complete a Lab Report" (found in D2I) to write up your first formal lab report


